Gold is finding support in the $1950 area on this week’s declines but is not finding support from buyers on the rally above $1985.

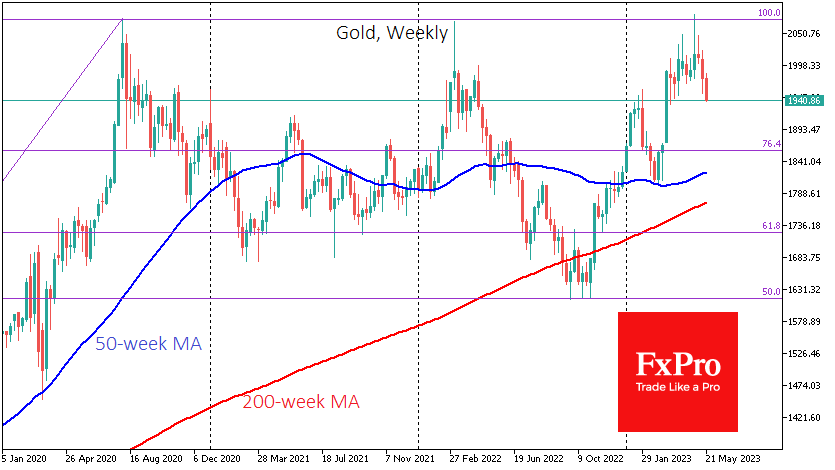
Support for this trading range is provided by the area of the late January price peak, which has also acted as a pivot point more than once in this growth cycle, halting the rally. The ability to hold above this previously strong resistance for an extended period is an important signal for speculators.
The area from which gold was bought in the second half of April has become a local resistance.
On the side of gold buyers, there is a risk appetite on the back of expectations that the world’s major central banks will end their rate hike cycles one by one, promising at least a pause to assess the situation. In addition, reports continue to emerge that emerging market central banks are continuing to diversify away from the dollar in favour of gold.
On the sell side, there is a broader set of factors. There is a pullback into the dollar now that the US regional banking crisis no longer scares large holders. As a result, gold and bitcoin have given up almost half of their gains from the March-May momentum.
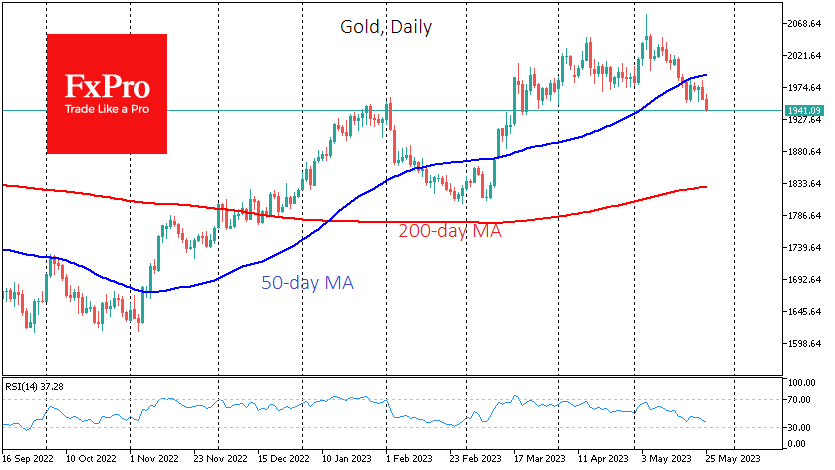
Gold has also accumulated a certain amount of technical fatigue. Combined with the recent bearish momentum, gold has broken below its 50-day moving average, which has given the bulls an extra boost.
However, a dip below this curve is not necessarily a sign of a trend reversal. Gold traded below its 50-day for a month from February 10th but soon found support in the 50-week average, which was above $1800 then.
Gold’s decline from the highs in early May removed the divergence between the RSI and the price action, which was a bearish signal. If gold does not come under further pressure in the coming days, this could be an important signal for a new round of gains that could take the price above $2100. However, this new all-time high has the potential to attract more bullish attention and become a prologue to further gains towards $2600.
A breakout of the current bearish range could pave the way for a strong move to $1810-1830, where the February lows and the 200-day average are located.
The FxPro Analyst Team