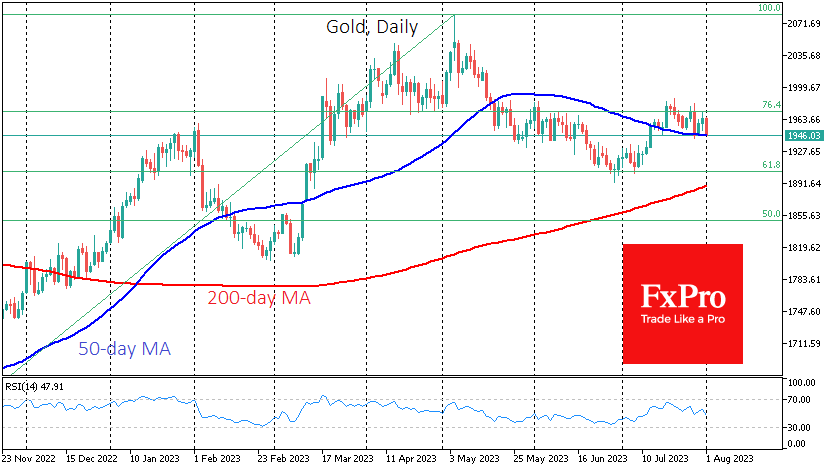
Gold has been sticking to support at the 50-day moving average since July 13th but has not found enough strength to break away from it. The markets tested the uptrend again last Thursday amid a wave of dollar strength. On Tuesday morning, Gold is down 0.6%, falling back to $1953, just $6 above this curve.

Technically, the ability to hold above this line would be a significant tactical victory for the bulls. It would dispel buyers’ doubts about the precious metal’s ability to move higher in an environment with the highest interest rates in more than twenty years and investors’ attempts to jump into equities after months of rallying.
The longer-term technical picture remains bullish, with gold trading above its 200-day average since last December and the corrective pullback of May and April representing a precisely calibrated Fibonacci retracement of 61.8% of the November-May advance.
Nevertheless, the gold market looks balanced locally, with the RSI now barely above 50 on the daily and 55 on the weekly timeframes.
Fundamental factors on the precious metal’s side include investor sentiment that the Fed is done raising rates after a string of weak inflation data in recent weeks.
The ability of the bulls to defend the $1947 level for the third time in less than a month could encourage them to buy, taking the price to the area of the historic highs at $2050 and renewing them from there. This is the base case scenario.
However, the short-term downtrend that has formed in recent weeks raises the question of the near-term downside targets in the event of a breach of support. Consolidation below $1947 could open a direct path to the $1900 area with the risk of a long-term trend reversal to the downside.
Other precious metals are not happy locally. Platinum is down over 2% on Tuesday, with the 50-day moving average acting as resistance since the middle of last month, shortly after forming a “death cross” signal.
Silver’s losses for Tuesday alone are also approaching 2%, taking the price to $24.2, despite having an even better technical picture than gold. The first sign of a bullish retreat in silver will be a break below $24, making the latest decline more than just a mediocre correction.
The FxPro Analyst Team