Gold climbed close to $1855 per troy ounce in early trading on Monday and stabilised in a relatively narrow range of $1845-1853 during the European session. The rise from Friday’s lows of $1810 resulted from a combination of three factors. However, they all appear to be short-term and promise the evolution of an interesting situation.

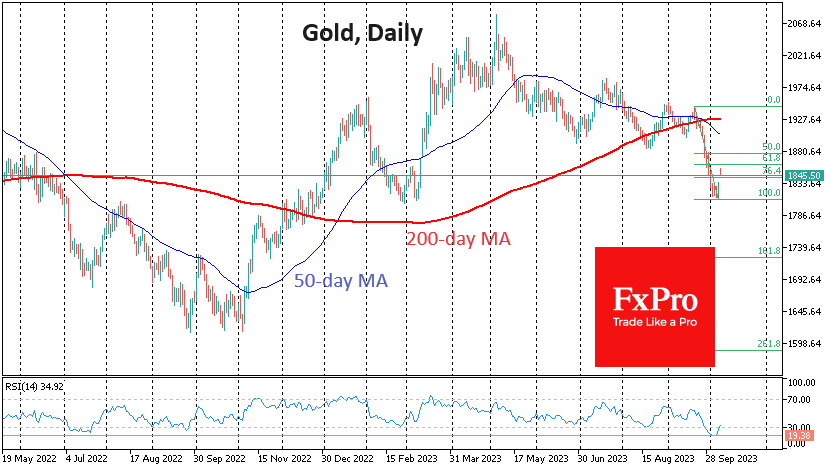
Gold came into last Friday’s session having built up an impressive oversold condition, losing almost every day since the 20th, falling 7% to a low near $1810. This sell-off has taken the daily RSI to 19, an extremely oversold level last seen in July 2015. An asset is considered oversold when the RSI falls below 30, and a reading below 20 is a rare event that at least a short-term bounce has always followed.
Gold buying on Friday was supported by rising risk appetite in equity markets as tepid wage growth figures accompanied robust employment data. As a result, US bond yields fell on expectations that the Fed would avoid further policy tightening.
On Monday, gold opened with a gap higher on the back of clashes between Israel and Hamas. However, the latest move is more of a knee-jerk reaction to the news than a sustained, extended move. Still, gold bullion is hardly the quickest and easiest way to protect capital from war these days: transferring wealth into another currency or bank is much easier and more efficient.
We should, therefore, be prepared for the recent rally in gold to be reinforced by short-term profit-taking, which will only encourage the bears.
The classic Fibonacci retracement pattern suggests a potential upside to $1862, or 61.8% of the original downside amplitude. However, today’s top coincides with the rally we saw in gold in late February and early March. Very soon after, the market turned to a new round of declines.
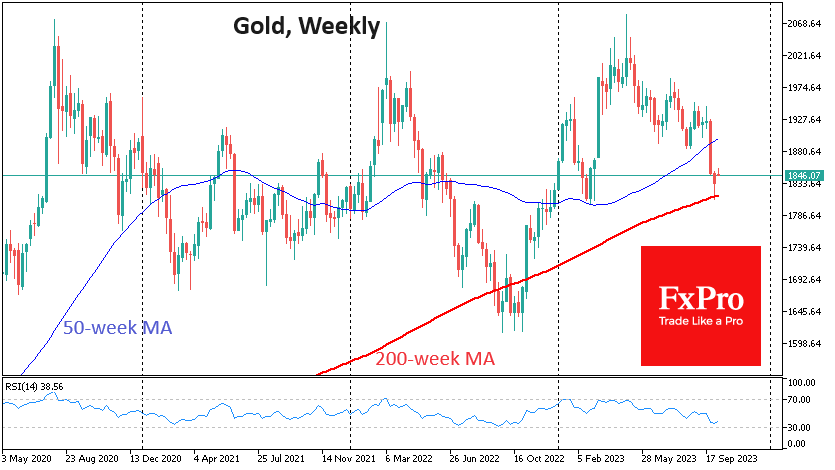
The triumph of the bears was then prevented by the crisis in regional banks in the US, which led to a rush into gold and the major cryptocurrencies. The 50-week moving average was the technical support at the time. Now, the 200-week moving average is taking on the role of support.
Gold may make another attempt to break below $1810 in the coming days. We could see a quick fall to $1760 if the bears succeed.
At the same time, we cannot completely rule out the possibility that gold will start to look attractive to long-term buyers from these levels, having begun another gentle climb.
The FxPro Analyst Team