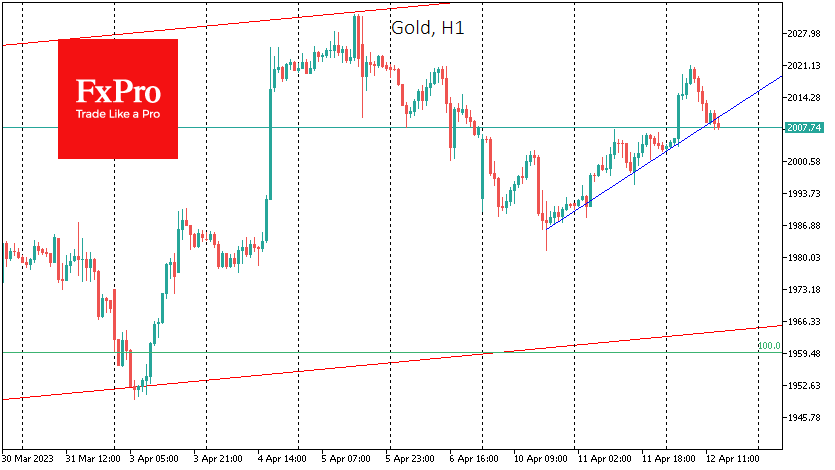
Despite its proximity to historical highs, the short-term momentum suggests that buying will intensify even on minor pullbacks. A week earlier, gold made a local high of $2030 and then corrected by 2.25%. The intraday chart on Monday afternoon clearly shows a bullish trend. The intermittent spikes in the Asian session were not sustained, but this trendline remained in force.

It appears more like a large buyer building up its long position than speculating on the news. This mini-trend will be challenged if it falls below $2008. The final break of this trend will come when it falls below the previous local lows of around $2002.
But it is worth taking a step back and looking at the more fundamental trends. The amplitude of gold’s move on March 20-21 created a broad and rising range in which gold has been trading. The lower boundary is now $1965, and the upper edge is $2040.
A further step back in time suggests that gold is now in bullish momentum, having completed an almost canonical Fibonacci retracement after rallying from the September-November lows to the February peak. The final target for this pattern is the $2170 area, which is nearly $100 above the historical highs.
If gold does rewrite the highs, it will be in an even longer-term growth cycle with a potential target of $2650. This is no longer a target for this quarter but for next year.
The most exciting thing is that the big buyers in the last few quarters could be the central banks of the big emerging markets, such as China and Saudi Arabia. In this case, gold is an alternative to dollar-denominated government bonds, which look politically unpalatable in the short term, whereas gold is politically neutral.
Nevertheless, it is worth recognising that, contrary to the long-term bullish picture for gold. The blow could be pretty painful for short-term buyers. Gold remains in a long-term bullish trend as long as it trades above $1950-1960. A pullback here could become a reality in the event of high inflation data or continued hawkish Fed rhetoric in the coming weeks, seriously punishing the most desperate bulls.
The FxPro Analyst Team