Gold dynamic reverses smoothly on the daily charts, setting up a double-bottom formation.
Gold is forming a local uptrend after touching the lows near $1680 at the very beginning of the month. The daily charts show that the area near $1700 attracts buyers.

Notably, the trend reversal in gold occurred a couple of days earlier than in the currency market. This ability to swim against the current indicates solid underneath demand.
Steady buying in gold broke the trend near the same levels as in July. At the same time, the RSI index in the daily charts set higher lows than two months ago. This divergence between the index and the price signals that the sell-off intensity is diminishing. At the same time, the index came out of the oversold zone, further indicating that the bulls are taking the local initiative.
However, so far, we see a local tug of war. Gold needs to overcome several markers to talk about a more global trend change.
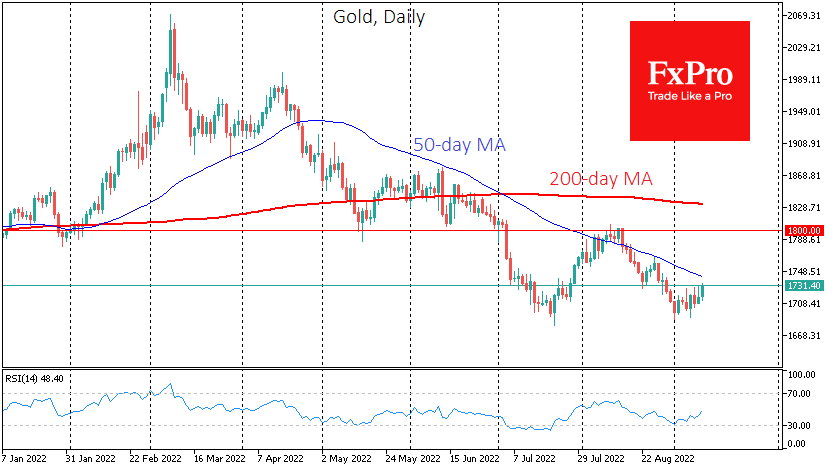
The first test of gold’s bullish reversal would be in the cross of the 50-day moving average near the $1740 area. Since April, bears got the upper hand after the price nears this line, so now we are looking at how the price will behave there.
Silver, the gold’s little sister, gained more than 3.5% on Monday and got well above its 50-day average. This is an additional bullish indicator of a reversal in market sentiment.
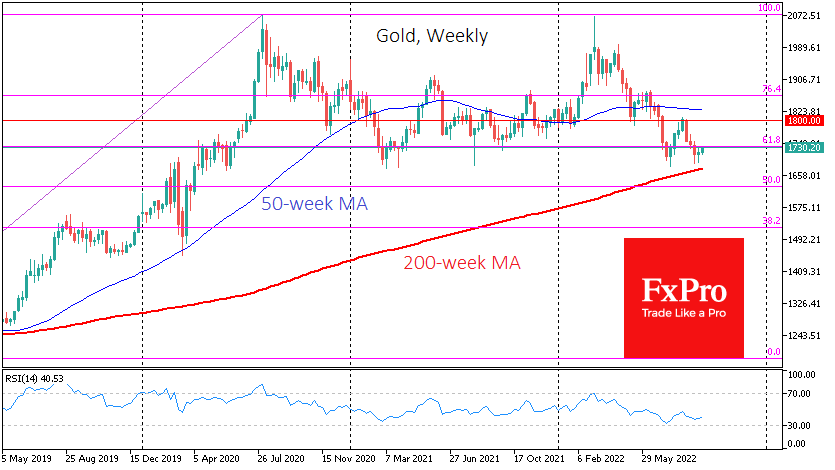
Should the bulls succeed locally, the next significant hurdle will be $1800, a psychologically significant round level and a local August peak. A consolidation above this level would confirm the formation of a “double bottom” and the completion of the downward momentum. In this case, the gold will open the road towards $1920-1970.
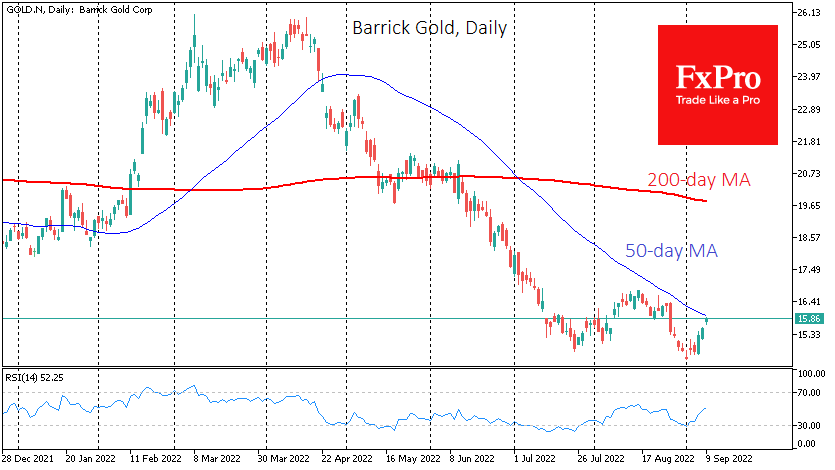
Outside the chart analysis, seasonality is also on the side of the gold, as the long-term trend reversal is in progress during August-September. Separately, we note the increase in trading volumes and impressive growth in equities in the sector. Barrick Gold shares added more than 9% to their lows at the start of September, while the smaller gold producer ETF has gained 10.5% over the same time frame.
The FxPro Analyst Team