After three weeks of consolidation, gold moved decisively upwards, hitting a record above $2572 per troy ounce on the spot market on Friday. The price rise has approached 3% since the beginning of the week and 25% since the beginning of the year, well ahead of the major stock market indices and against the general decline in base metals.

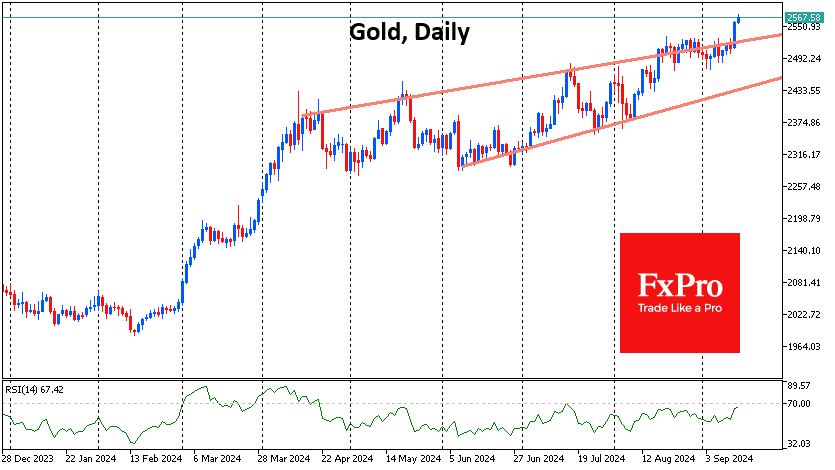
In terms of technical analysis, the latest spurt was an acceleration of growth after a prolonged consolidation with an upward bias since April. This pattern is called a rising bullish wedge, the upper boundary of which the price overcame yesterday. Although gold has been gaining steadily, the extended consolidation at the end of last month removed excessive local overbought conditions, clearing the way for a rally, some of which we saw this week.
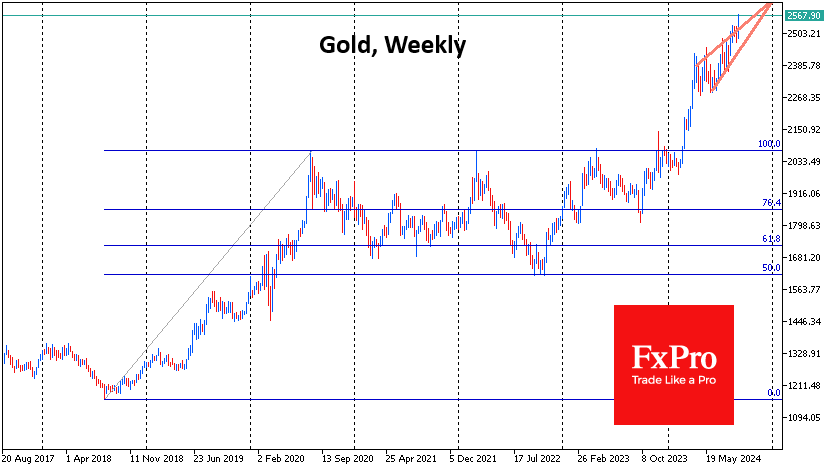
The realisation of this pattern indicates the possibility of a rise to the $2660 area, which is about $100 above current levels. A longer-term upside pattern to 161.8% of the initial two-year rise from August 2018, followed by a correction to 50% of that rise at the September 2022 lows, leads us to $2640.
Due to the triggering of abundant stop-outs, a quick rise into this area is possible, and this process could develop in an active US session on Friday or at the start of trading on Monday. However, the sharp growth may well be a suitable reason for the arrival of real sellers capable of turning the price.
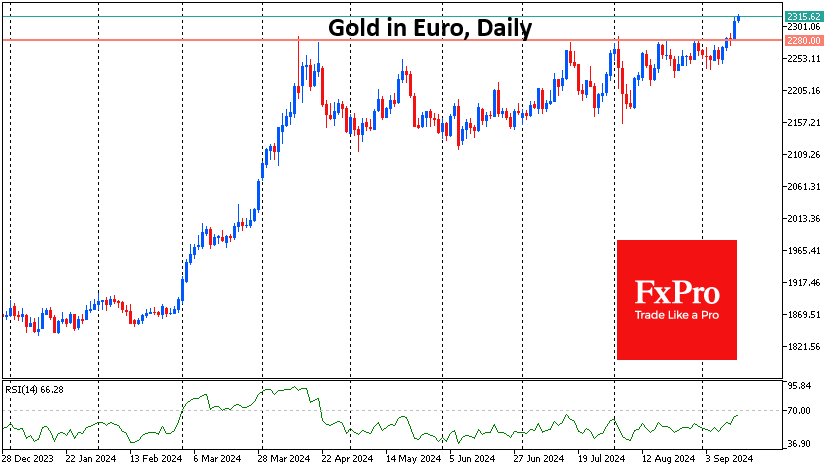
Separately, it is worth mentioning the dynamics of gold against the euro. From April to the end of August, the price bounced from the horizontal resistance on the approach to 2300 euros per ounce but overcame it with a sharp movement on Thursday. The prolonged consolidation after the rally of March and April suggests that we are only seeing the beginning of a rally.
The decline in bond interest rates is returning some of the appeal of gold to retail investors. From this perspective, it is worth being prepared that the expected Fed rate cut next week could reverse the trend. In 2015, we saw a similar situation, but in the other direction. Back then, gold fell for many months in anticipation of the first Fed rate hike, and the bottom was reached on the day of the hike. It is possible that this time, too, the fact may trigger a long profit taking, especially if it turns out that the Fed is not ready to soften policy so actively in the coming months, as investors expect.
The FxPro Analyst Team