Categories: Market Overview

GBPUSD fighting with a downtrend

The British pound is trying to swim upstream this week. It is growing, despite the sharp slowing of inflation and the first negative-rate government bonds auctions and despite the increased demand for protective assets on Tuesday.
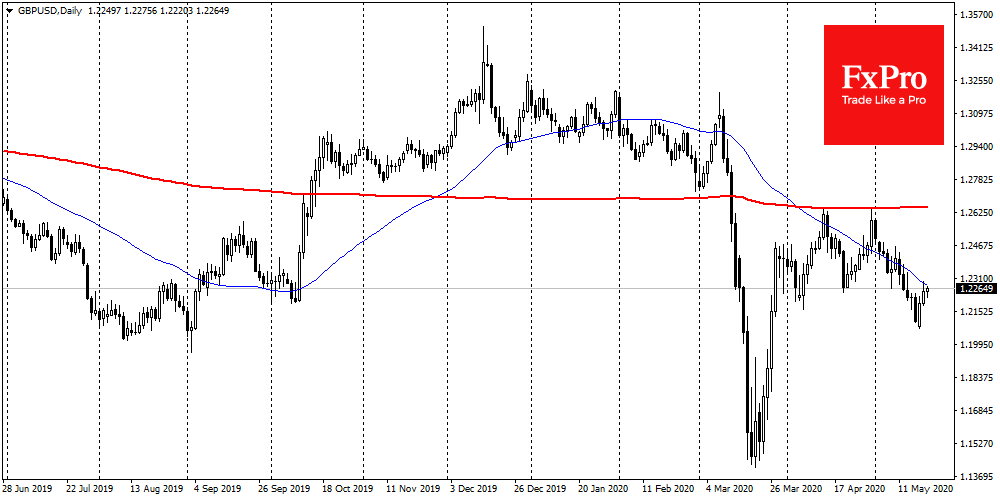
GBPUSD trading below 50- and 200-daily Moving Averages

Right now, the technical picture is not in favour of the British currency. GBPUSD is trading below the 50-day average, and earlier in April, it was twice thrown down from the 200-day, reflecting the prevalence of the downward trend.

Yesterday and today, the British currency trading close to the 50-day average – a critical trendline. A break may become a bullish sign for the pair. Still, the pound is an important indicator of demand for risks in Europe, and its strengthening can give a positive signal for the regional markets.

If the British currency fails to overcome the 50-day average confidently, the technical analysis suggests a new possible downward impulse to the ​​1.20 area over the next several days. GBPUSD fell below only in the worst times of the market crash in March and got strong support there. However, up to 1.2000 support looks quite loose. Several fundamental factors also are in favour of the decline: The Bank of England (unlike the Fed) does not publicly reject the idea of ​​negative rates, as markets expect this move in June. Besides, inflation in the country slows sharply, reflecting the weakness of consumer activity.

UK CPI slows sharply due to Transport and Housing categories

The FxPro Analyst Team

The FxPro Analyst Team

Our team consists of financial market experts. Our dedicated professionals prepare reviews on the foreign exchange market situation, Crude Oil, Gold and Stock Indices. All the analysts are regularly published in the world leading economic media.

Share
Published by
The FxPro Analyst Team
Tags: cpiGBPUSD

Recent Posts

GBPUSD Wave Analysis 14 November 2024

- GBPUSD reversed from strong support level 1.2665 - Likely to rise to resistance level…

5 hours ago

USDCAD Wave Analysis 14 November 2024

- USDCAD broke resistance level 1.3950 - Likely to rise to resistance level 1.4050 USDCAD…

5 hours ago

The dollar has reached range limits

The US dollar has strengthened, reaching the upper boundary of its trading range. The British…

8 hours ago

Crypto: Tug-of-war at new altitude

Cryptocurrencies continued to surge, pushing the total cap to $3 trillion. Bitcoin has gained nearly…

8 hours ago

USDJPY Wave Analysis 13 November 2024

- USDJPY broke key resistance level 154.70 - Likely to rise to resistance level 157.20…

1 day ago

USDJPY Wave Analysis 13 November 2024

- USDJPY broke key resistance level 154.70 - Likely to rise to resistance level 157.20…

1 day ago

This website uses cookies