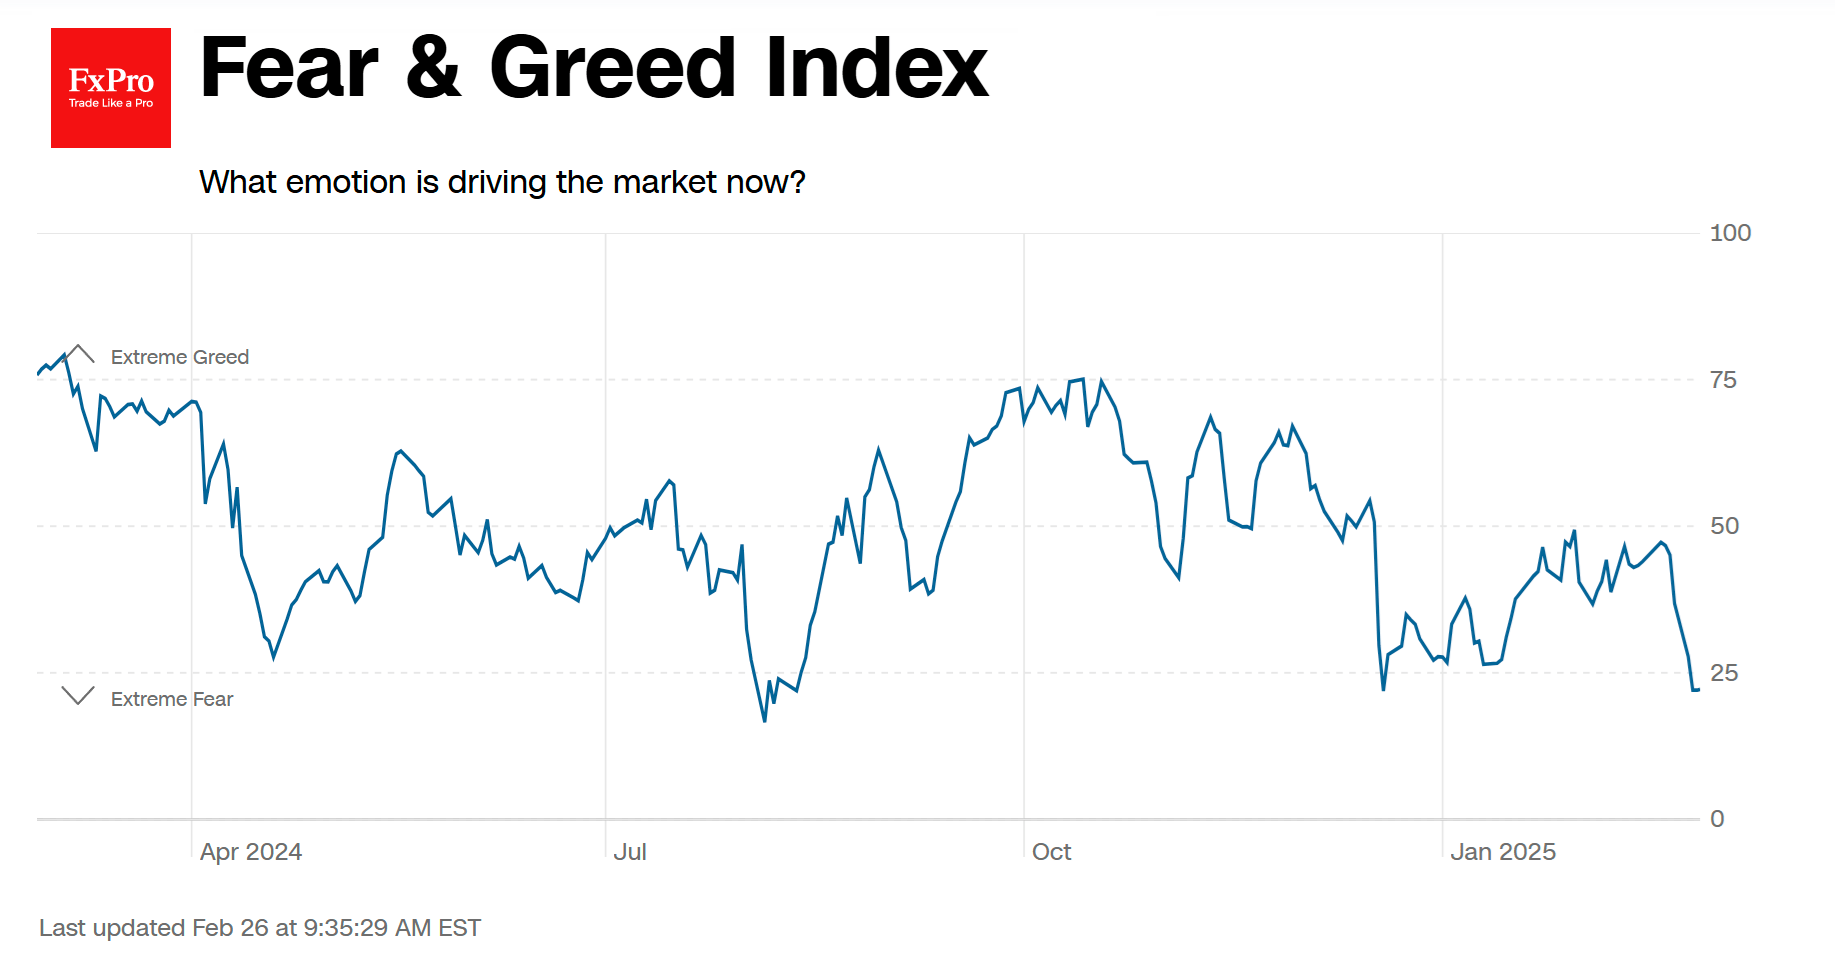
Extreme fear is driving US stock indexes, according to a popular CNN Business index. Their index has fallen to 22, repeating December’s lows. Only in early August last year did the indicator dip below 22 for a few days. An area of extreme fear is often seen as an attractive time to buy. However, the dynamics of the past year are forcing some adjustments to this rule. In both August and December, the lows of the Fear and Greed Index were well ahead of the market lows and would have forced rash investors to endure several anxious sessions, even if they were able to buy at the peak of fear effectively.

It was much more rational to stay on the sidelines and join the rally only after the sentiment index had risen sharply out of fear territory.
Let’s look at the individual indices. The S&P500 was back below 6000 at the start of the week and below its 50-day moving average. Since the second half of January, it had been heavily bought on touching this curve, but the buying strength was clearly not enough to push it further into historical highs. At Tuesday’s low, the S&P500 was close to the lower boundary of the ascending channel that has been in place since late 2023. A break below 5900 could trigger a broader sell-off in equities well beyond the US. An even more dramatic scenario could be triggered by a break below the 200-day moving average (now at 5750).


Indirect warning signals include the double tops on the Nasdaq100 and Dow Jones indices, which is a trend reversal pattern. It is important to note that the tops on the indices were formed at different times, which reduces their correlation and thus increases their significance.

At the same time, the basic scenario in such cases is still a rebound from the lower boundary and a move towards the upper boundary, which is now above 6600. The bulls are temporarily favoured by the relatively subdued dynamics of the VIX. This volatility index remains below 20, the level above which is often the first signal that the market is going into selling mode.

The FxPro Analyst Team