

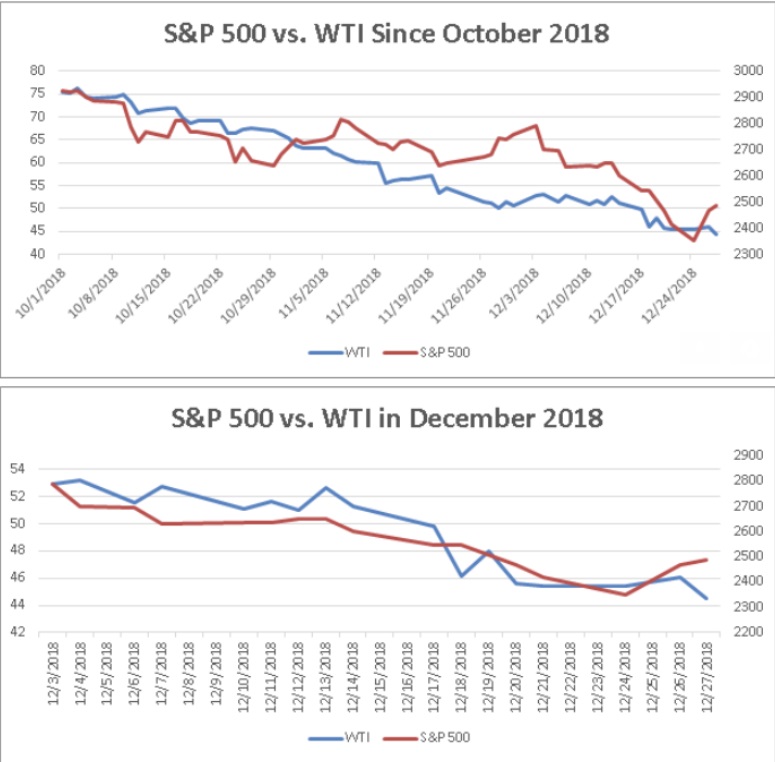

It isn’t your imagination, the oil market and the stock market have been moving together to an uncanny degree amid twin selloffs that have sent both down sharply since their October highs. According to Leo Chen, portfolio manager and quantitative strategist at Cumberland Advisors, the prices of West Texas Intermediate crude CLG9, +2.21% the U.S. oil benchmark, and the S&P 500 SPX, -2.48% were nearly 79% correlated since the October selloff began through the end of December. A correlation of 100% would mean prices moved in perfect unison. In charts he shared with MarketWatch (see below), Chen noted that the correlation intensified in December, hitting “a very high level” of 89.72%.
WTI oil futures notched a nearly four-year peak above $76 a barrel in early October but rapidly skidded, pulling back more than 20% by early November and meeting the widely used definition of a bear market, and then continuing their slide. The S&P 500 hit an all-time high in late September and has lost more than 16%. The blue-chip Dow Jones Industrial Average DJIA, -2.83% has also fallen sharply since notching a record close in early October, while the tech-heavy Nasdaq Composite COMP, -3.04% entered a bear market last month.
Stocks and crude managed to diverge on Thursday, with oil gaining ground on reduced output as equities logged steep losses following a revenue warning from Apple Inc. AAPL, -9.96% that served to underline concerns about growth in China and a downbeat reading on U.S. manufacturing activity.