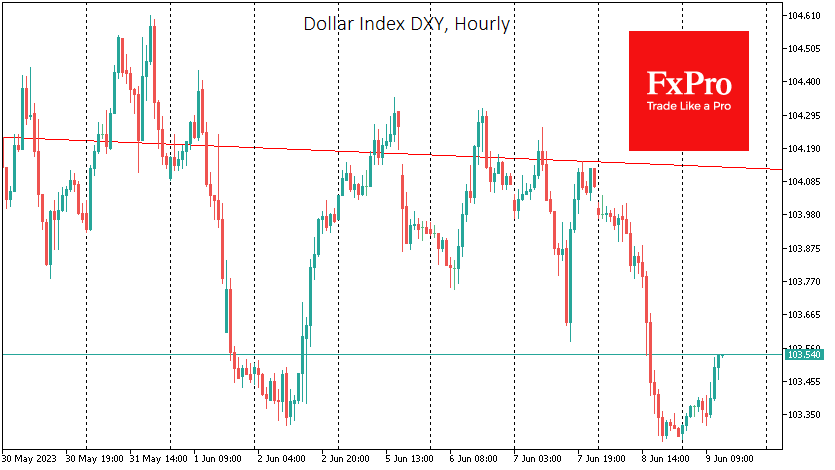
The dollar index lost about 0.7% on Thursday, briefly bouncing back under 103.3. The dollar’s rise against a basket of major currencies stalled late last month and has been trending lower since early June. A situation has developed in which fundamentals are bullish for the dollar, while technical analysis of the medium-term trend favours a decline.

The resolution of the debt ceiling problem forces the US Treasury to return to debt markets with placements. Such actions drain liquidity from the financial system and often cause the dollar to strengthen, as investors prefer US government debt to stocks and bonds of many other governments. And the latest announcements from Treasury Secretary Yellen are setting up near-record placements. What makes the situation unprecedented is that the monetary policy has been stimulative in previous episodes of large auctions: a sharp contrast with the 5% key rate and the Fed selling funds off the balance sheet.
Since the beginning of June, the US Treasury has raised a net capital of $139bn. This is a lot, but because of the accumulated pent-up demand and the buffer built up, we have not seen a noticeable pull into the dollar or a significant sell-off in equity markets. But demand will be saturated, and available liquidity will be depleted, which should work to the dollar’s advantage and is a headwind for equity and commodity markets.
At the same time, the chart picture is still against the dollar. The DXY has been forming a sequence of declining local highs and lows over the past two weeks. It is also easy to see a series of lower peaks on the daily timeframes. Globally, this trend has been in force since last September but has been in the form of a downward channel since December.
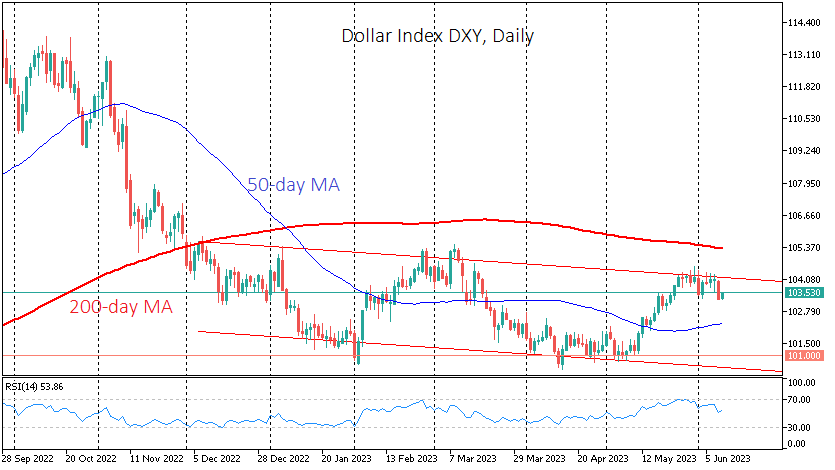
In this latest trend, the DXY, having reversed from the upper boundary at the end of May, is now heading towards support below 100.5.
Also in favour of a further decline in the dollar over the next couple of weeks is the return of the RSI from overbought territory, often accompanied by a more substantial pullback.
A bearish “technical” scenario looks quite realistic if the US Treasury does not rush to test the financial system by vacuuming up market liquidity but rather gently probes the ground. There is room for manoeuvre for the US government, as taxes will flow into the Treasury accounts in the coming weeks.
The FxPro Analyst Team