The US dollar had reversed, losing 2.6% to a basket of major currencies from last Wednesday’s highs when the DXY was making multi-year highs. Although the dollar sell-off is very active, it looks more like a profit taking than a reversal.

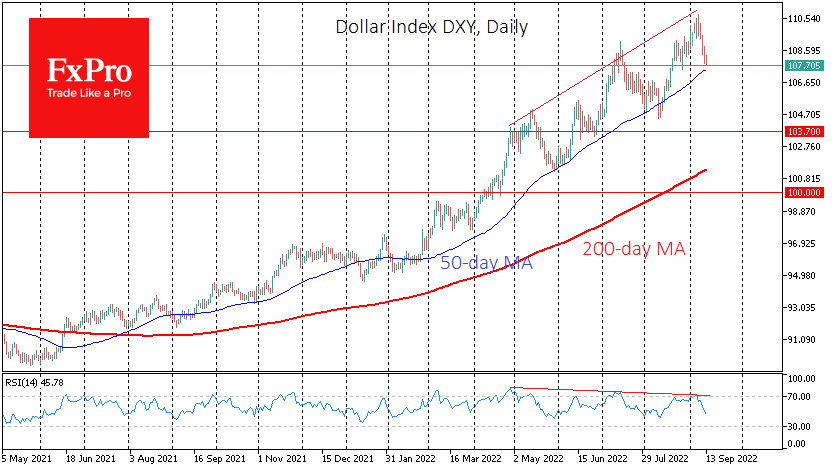
The current rally in the dollar started last June, and most of the time, the 50-day moving average has repeatedly acted as support during corrective pullbacks. This curve now passes through 107.4, 50 points below the current price, which preserves some potential for further retracements.
Meanwhile, the fundamental growth driver was the markedly more aggressive monetary policy than the leading competitors. And so far, there are no currencies from the DXY basket which are raising rates as decisively. The gap between short-term interest rates thus remains in favour of the dollar.

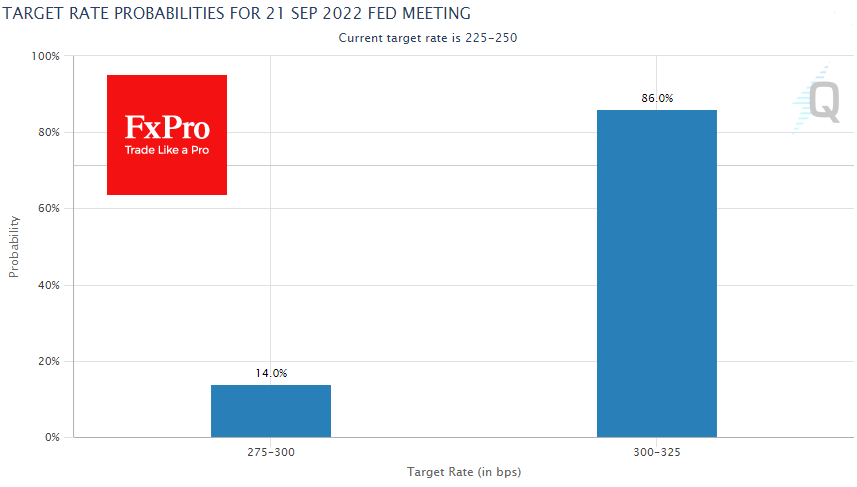
However, the dollar is by no means vulnerable. The latest impulse for growth comes as traders have priced in a third successive rate hike of 75 points at the next meeting on September 21. According to CME’s FedWatch tool, the market estimates an 86% probability of such a move.
However, the likelihood of further Fed sharp hikes may be questioned due to inflation and consumer activity. Later today, US CPI data is released, which is expected to slow from 8.5% to 8.1% y/y.
Investors and traders are also looking at inflation expectations. The latest Reserve Bank of New York survey noted a return of 3-year expectations to 2.76%, which is within the 2015-2021 range, meaning it can be considered the norm.
A combination of two factors could reverse the dollar’s trend: (1) a slowdown in actual and expected inflation and (2) the Fed’s immediate acceptance of this. There could be problems with the latter – mirroring how the Central Bank behaved before the first half of last year.
Among the technical signals of a reversal in the dollar is the 50-day average. A decisive slide below 107.40 over the week runs the risk of triggering a wider liquidation of longs in the American currency. We also pay attention to the divergence between the DXY price and the RSI index on the daily charts, where lower relative strength index highs match higher local highs.
The FxPro Analyst Team