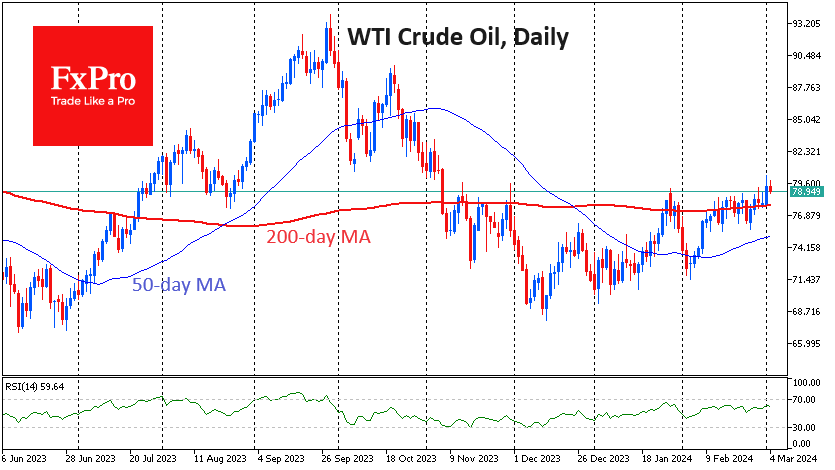
Oil is correcting 0.2% on Monday after closing almost 2% higher on Friday and peaking at 3.4%. WTI’s high of $80.3, last seen in November 2023, and a consolidation above $79 would indicate a break of long-term horizontal resistance, something the bulls have failed to do over the past four months.

Friday’s rally allowed a widening gap to the 200-day moving average, which should also be seen as a demonstration of bullish strength. Technically, there is no significant obstacle to oil rallying to the $89-92 area.
Of course, this bullish outlook is only valid if the coming days confirm oil’s ability to grow from current levels, which has not been the case since November.
OPEC+ is openly playing on the Bulls’ side by extending and strengthening (Russian) oil production and export quotas. The production recovery is postponed indefinitely “depending on market conditions”.
This could be a golden opportunity for the US to regain oil market share, but it is in no hurry to do so. Friday’s data showed that the number of oil drillers rose to 506. That’s the highest since September, but only adding 9 units from the low of 497, which is more stagnation than growth. Just over a year ago – in January 2023 – there were 623 oil and 152 gas-producing wells in operation, compared to 123 now.
Perhaps the price rise will encourage oil producers who are still wary of the green agenda and new sudden price falls. Simply put, America has so far been highly sluggish in playing on the Bears’ side.
The FxPro Analyst Team