- Bitcoin whales and trading vs. holding
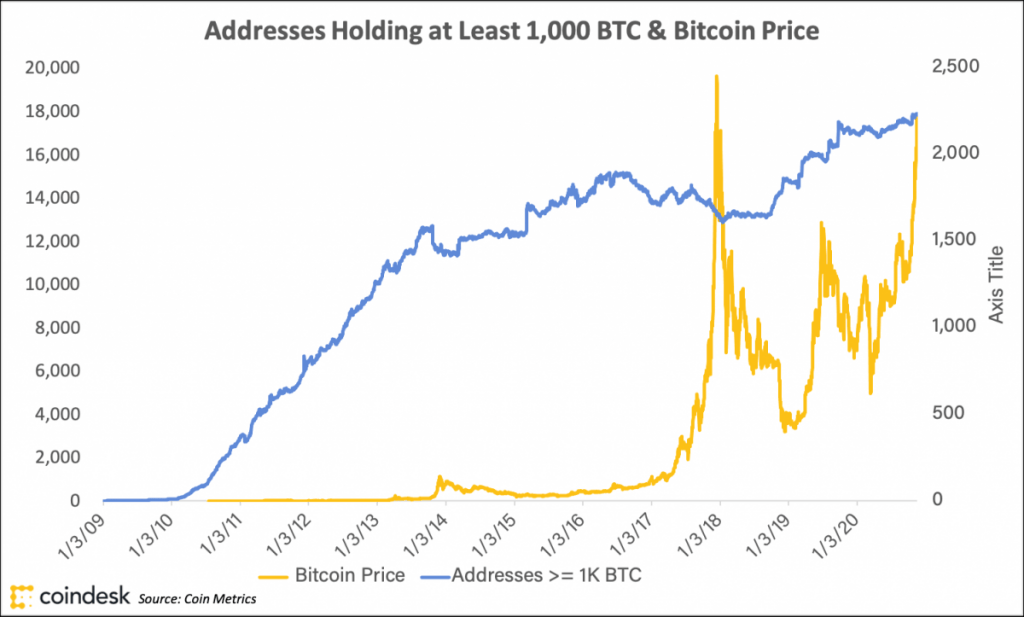
The number of addresses holding at least 1 bitcoin increased at an unrelenting pace from the end of 2013 to the 2018 crash. It picked up again in 2019, then leveled off again this spring. This is different from the end of 2017, when it soared to a peak with the bitcoin price. Compare that to the number of what we could call bitcoin “billionaires,” addresses holding at least 1,000 BTC. These whales were selling into the run-up in 2017. This time, the Bitcoin blockchain’s Forbes List is growing, not shrinking.

- Bitcoin vs. ether and everything else
The 2017 bull market is remembered as a phenomenon driven by enthusiasm for initial coin offerings (ICOs) on Ethereum (ETH, +13.22%). However, by the time the frenzy reached its fever pitch, ether (ETH) had largely completed its run. At the midpoint of 2017 Q4, bitcoin returns were 23.9%; ether returns were 6.9%. It was bitcoin’s Q4 catch-up run that fed the bulls. Contrast that to 2020, and the similarities and differences are telling. Again, ether led the run-up, but this time it’s keeping pace with bitcoin, returning 23.2% so far on the fourth quarter to bitcoin’s 28.4%, even before it crossed $500, early Friday. If 2017’s pattern repeats, the bitcoin bulls may have a longer range to run.
So, are crypto markets consolidating? The answer is, yes and no. Bitcoin dominance, the orange coin’s share of cumulative market cap, is in the high 50s. Usually, that means a shorter list of assets that compose the bulk of the market. Not this year.
Top-five assets in the CoinDesk 20 are growing with bitcoin, but the long tail is now more fragmented than it has been since the aftermath of the 2017 bubble. (This tally includes stablecoins and other pegged assets.)
- Regulated vs. off-shore futures markets
The “institutions are here” chorus can sing about the growth of the CME Bitcoin Futures market, signaling increasing demand for regulated exposure to bitcoin via established operations channels. Open interest on the CME hit $1 billion this week, an all-time high.
However, much of that growth is attributable to bitcoin’s price run. And in aggregate, lightly regulated derivatives contracts, traded by individuals, prop desks and liquidity providers, dwarf the CME. It would be unwise to base an institutional flippening thesis on growth in the CME alone. Better to say institutional participation is growing with the rest of the market.
- N. America vs. E. Asia investors
Parallel to the growth of CME futures is the flow of bitcoin onto North American exchanges, and off of East Asian exchanges.
To the extent exchange flows represent the activity of participants, East Asian investors have been selling bitcoin into this bull market at rates never before seen. Meanwhile, North American interest in bitcoin is greater than it was in 2017.
One important caveat: the flows here may represent the preferences of traders more than the long-term activity of investors. The stablecoin tether (USDT, -0.01%) is on pace to grow its market cap by more than $10 billion this quarter. Some of the flows in East Asia likely represent Tether’s (USDT) march toward quote currency dominance, as traders increasingly favor it over bitcoin in crypto-to-crypto markets.
Conclusion
The takeaway: This bull run is indeed different from 2017, though that doesn’t mean we won’t see another peak-and-trough cycle. Signals that hint at the kinds of investors who are participating indicate we may be earlier in the cycle than we were when bitcoin hit its all-time high three years ago. Bitcoin’s history is full of narratives about upcoming shifts or regulatory change s that would change the market fundamentally. Those narratives have been overblown in the past, and they’re probably overblown now. The same is true of narratives that foretell the dollar’s demise.
Crypto Long & Short: 4 Metrics That Show How the Current Bitcoin Rally Is Different From 2017, CoinDesk, Nov 23