Oil reversed sharply from bullish to bearish on Tuesday, losing around 6.5% and below $75/bbl WTI. The reversal fits neatly into a tapered triangle pattern, with a setback from the upper boundary earlier in the week to the lower boundary. A knock to the upside from current levels would allow oil to return to $80 quickly. However, a break below the previous local lows at $74 would signal an exit from the consolidation pattern.

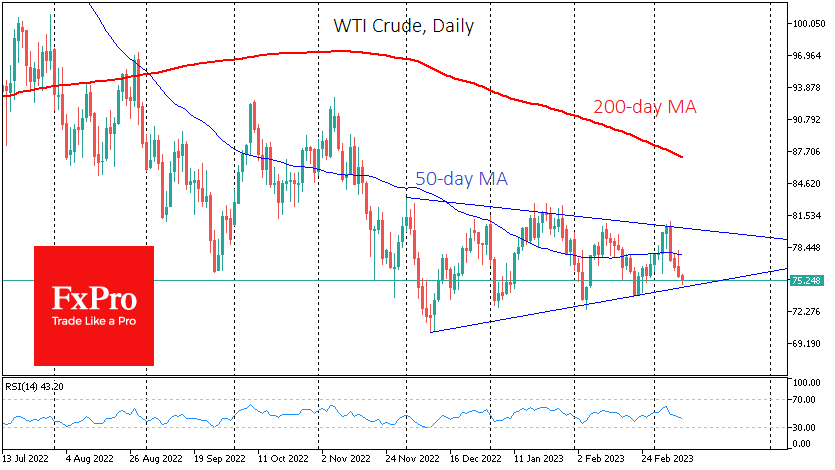
Since last December, oil has formed a triangle with its centre of gravity at $77 (the local lows of September and November) and a steadily shrinking trading range. Oil is successfully balancing news of production cuts and a strong labour market (positive) with monetary tightening and signs of falling demand.
A look at the charts suggests that oil is now choosing its path forward. A reversal to the upside from current levels could be the prologue to a relatively quick return to the $80 area.
A close below $74.5 would signal a break in the consolidation pattern of recent months. Confirmation of the bearish signal would come with a drop below $74.0, close to where oil bounced in February. In that case, oil would face a smooth road to $62-63 by the end of the year’s first half.
The FxPro Analyst Team