Crude oil is hitting five-week lows, trading at $78.3 per barrel WTI. Oil volatility has been declining for two years, forming a sequence of lower peaks and higher lows. A very similar pattern in oil was formed in 2011-2014 and resolved with a 75% collapse in the price during a year and a half of decline. The alternative suggests a prolonged sideways pattern.

Oil started July by attempting to break the downside resistance that has been forming on weekly timeframes since March 2022. A slowing global economy and stagnant demand support reversals from lower and lower levels. The only thing holding the price back from a real collapse is the fact that the oil supply has also been shrinking or stagnating in recent months.
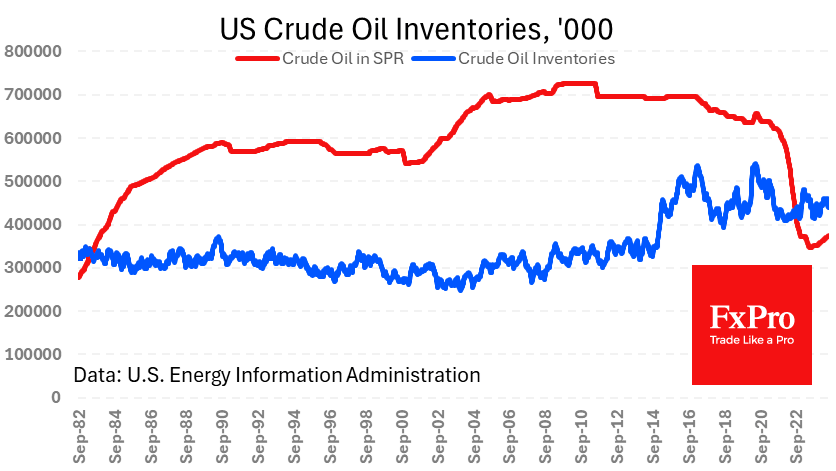
Notably, oil reversed downwards last week despite the rather bullish news on inventories. Commercial oil inventories fell by 4.9 million barrels and 20.5 million in three consecutive weeks of declines. Total commercial inventories are estimated at 440 million barrels, down 3.8% from a year ago. The strategic reserve was replenished by 0.65mn for the week to 373.7 million (+7.7% y/y).

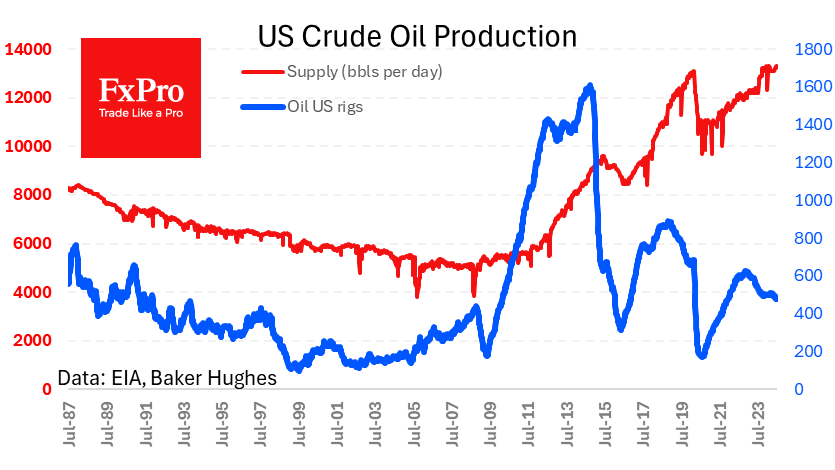
The US has been producing at a rate of 13.3mbpd for the past two weeks, the all-time ceiling, but with little increase since last October. The Baker Hughes report on Friday saw the oil rig count fall by another 1 unit to 477, updating the lowest since December 2021, although the price is roughly where it was in early 2024 and 2023.
From a macroeconomic perspective, the trend in oil will be determined by the supply/demand balance. In recent weeks, there have been increasing signs that demand is losing traction, although these signs are too few to set up oil to depreciate. Tech analysis may come to oil’s rescue.
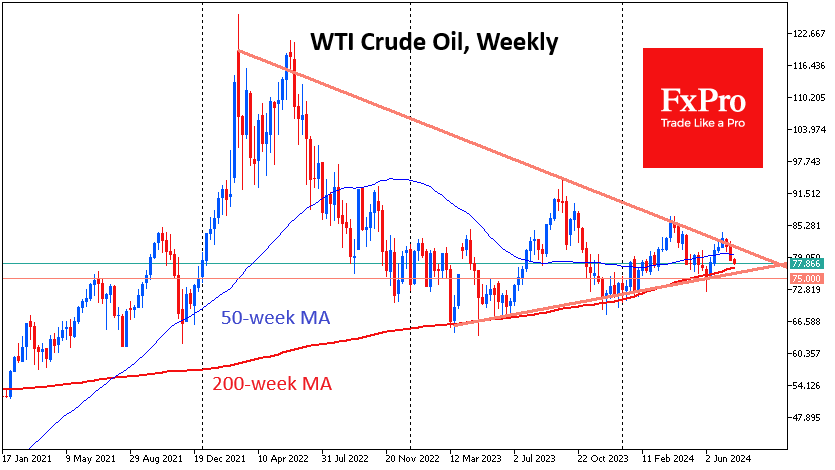
Oil at $77.7 is testing crucial support in the form of the 200-week moving average (now at $76.7) for the second time in eight weeks. Since the beginning of 2023, touches of this line have coincided with significant interventions by OPEC+ when the cartel reduced quotas or postponed their increase.
In this regard, we should not conclude the bearish trend in oil until the price falls below $75 per barrel of WTI or $79 per barrel of Brent. Breaking this support, if it happens, could start a sell-off in oil proportionate to what we saw in 2008, 2014 or 2020. Adding to the nervousness, July was a turning point for oil in 2008 and 2014. But until that event, the base case scenario still looks like a rebound bet.
The FxPro Analyst Team