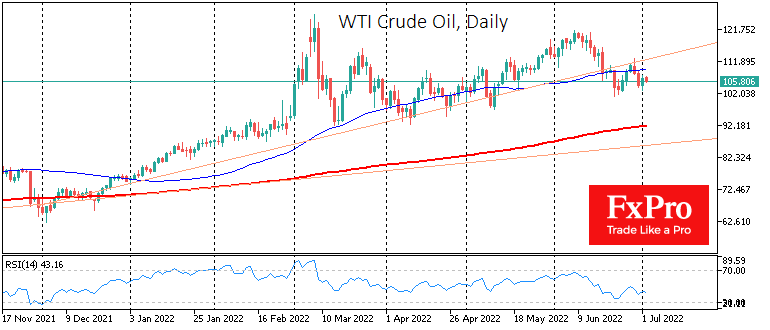
WTI closed last week with minor changes, close to $107. The dynamics of the previous two weeks indicate a timid attempt to return to the bullish trend after the correction. However, there are more signs of an end to the bullish trend so far, despite the rebound.

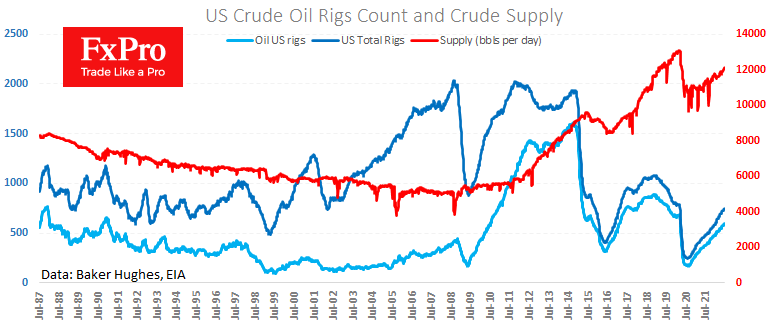
The US oil producers are expanding their drilling activity. Baker Hughes reported last Friday that 595 oil production rigs are operating across the country, up 1 for the week and +219 for the year. It takes about half a year from drilling to production, and that’s a substantial margin for the future.
The production dynamics suggest that there are enough wells already in operation to replace those that have run out and ramp up supply. Production last week was 12.1m BPD. More oil than America has produced in its history for only 13 months since March 2019. So, a lot of oil is already supplied, some of which the US can export.
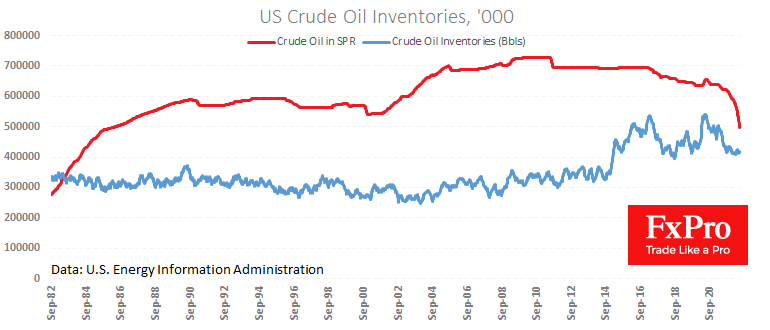
Meanwhile, the strategic reserve continues to sell off at a record pace, dropping to levels where it last was in 1986. Interestingly, these government interventions are sufficient to stabilise commercial reserves.
The US is no longer short of oil and petroleum products, conditionally sending the surplus through overseas sales from reserves. Initial logistical difficulties and seemingly endless production force majeure in OPEC countries (the new incident in Libya at the weekend) are holding back the fall in quotations.
Oil trader Vitol, before that Trafigura, spoke of signs of oil demand destruction at current prices. Previously, after 2010, oil prices above $100 were also holding back economic growth and could only hold higher for as long as monetary or government stimulus was in effect and crashed as soon as conditions started to tighten. That is precisely the situation we are now in.
The technical analysis of the charts, in our view, remains on the side of the bears. The WTI price has failed to break above the former uptrend support line and remains below the 50-day moving average.
Should the oil price fall below last month’s low of $101, it would signal that the bears are gaining an increasing advantage, and further declines could accelerate sharply. A complete correction of the latest bullish rally could be a return to $92. However, a deeper slide towards $80-85 cannot be ruled out if economic data worsens further and inflation requires further decisive rate hikes.
The FxPro Analyst Team