Stock indices are strengthening and the pressure on the dollar is gaining momentum. Futures on the S&P 500 added more than 3.6% within two days, more than recovering from the drop it took on news of pausing the relief package negotiations. Yesterday Trump reported that discussions would continue, bringing back to the market its main growth driver over recent days.

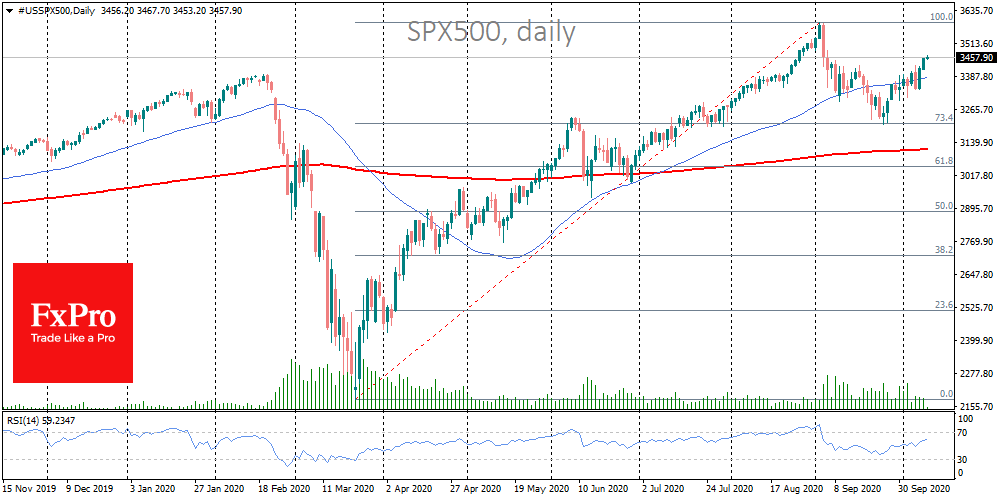
The short-term technical picture of the market is now on the bull’s side, noting a recovery in customer interest after the September slump. The RSI returned from overbought last month and stabilised in the middle of the scale early in the week.
This decline was clearly in line with the Fibonacci correction patterns, indicating a further short-term growth impulse. Without significant obstacles, the S&P 500 could quickly return to historic highs over the coming days and rewrite them again later in October.
The discussion of stimulus packages and Trump’s desire to support consumer sentiment before the elections can confidently push up the indices on the promises of massive support packages combined with a reluctance to close the economy again in response to rising coronavirus rates.
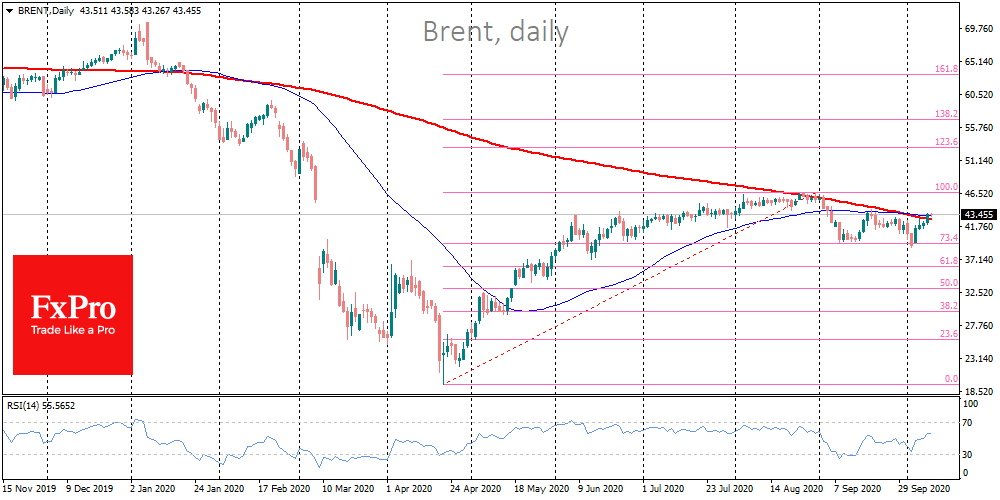
These factors also benefit oil which has managed to overcome a psychologically important technical level. Brent prices went above the 50 and 200-day averages after a 3% jump on Thursday and more than 11% growth so far this week. There is also a recovery of interest in oil due to speculation about improving economic prospects through incentives.
Growth of oil intensified with the fall in production in the USA due to hurricane season, recently causing another suspension of drilling in the Gulf of Mexico. Besides this, the armed conflict between Armenia and Azerbaijan is also dragging the quotes up.
The continued positive trend makes the price above $46.5 on Brent likely to be the next bull’s target. An increase above this level will return prices to levels that were last seen in March. This growth will allow Crude to trade above the annual average (200-day average) for the first time in almost a year.
Simultaneous growth in stock indices and oil could be an important factor in the wider recovery in demand for risk assets, maintaining a steady pressure on the dollar and yen and partially supporting interest in EM currencies.
The FxPro Analyst Team