Market focus The trade disputes escalation is driving force for the markets at the moment. The increase in tariffs on the part of the United States and the announcement of China’s response measures caused a powerful wave of pressure on the markets, which the politicians of both countries tried to ease. Both China and the United States do not overlook the situation in the financial markets, therefore they support the market participants in the belief that an agreement will be concluded. The U.S. noted that they want to hold public hearings on tariffs, and a high-ranking official in China noted that the world’s largest economies “have the ability and wisdom” to resolve trade disputes. It is hard to remember when there was so much dissonance on the markets between disappointing actions so promising rhetoric.
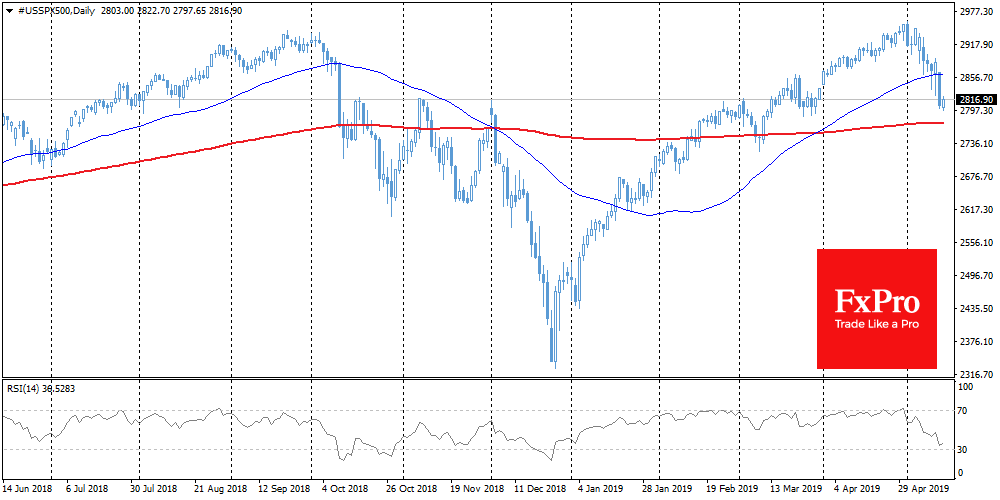
Stocks US indices: S&P 500 and Dow Jones lost more than 2.4% during trading in the US. On Tuesday, they rebounded slightly from 6-week lows, following politicians’ attempts to regain faith in a deal. However, technically existing market dynamic is more like a short-term rebound than a longer-term reversal to growth. The S&P 500 with a powerful movement declined under a 50-day moving average. A sharp break of important levels is often a precursor to the development of the movement in the direction of a breakthrough. The next important support is the 200-day moving average on the S&P 500 passing through 2774.
EURUSD The single currency was once again dropped on the approach to the MA50, which further underlines the importance of this resistance. Increased pressure pushed EURUSD down from 1.1260 to 1.1220 by Tuesday morning. Today, both the MA50 and the resistance of the downward corridor pass through 1.1260. Growth above this level is able to mark the breakdown of the downward trend. However, maintaining tension in the markets increases the chances of the pair reversing down to the lower border at 1.05. In the case of a trade conflict worsening, the pair has the potential to be there as early as May.
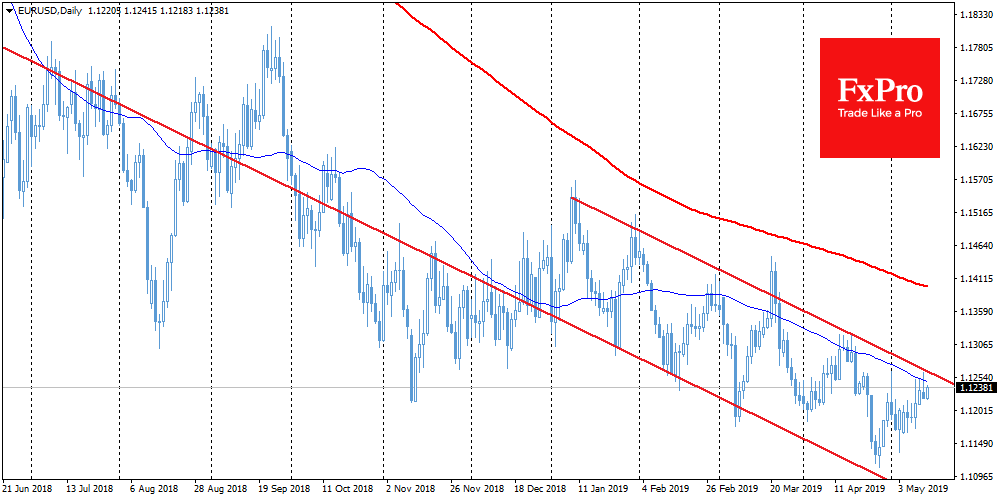
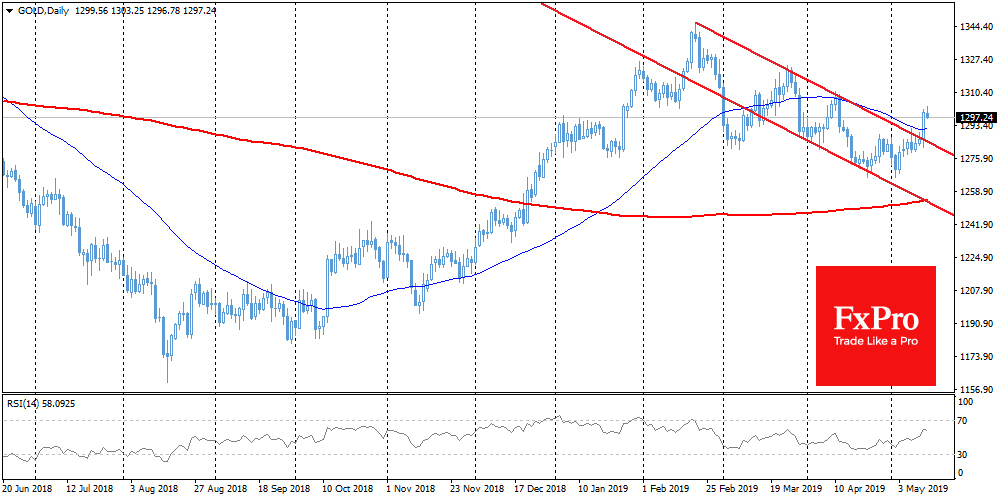
Chart of the day: Gold The surge in stock market volatility has brought gold back into the spotlight of investors as a defensive asset in a period of turbulence. Gold sharply broke through the resistance of the downward channel at $1285 and rose to $1300. On Tuesday morning, market participants carefully took profits after a 1.3% jump following cautious purchases on stock markets. Technically, growth above $1310 will confirm the breakdown of the downward channel, which is able to attract the additional interest of buyers.
The FxPro Analyst Team