A bullish picture is forming on the Nasdaq100, suggesting that we see the beginning of a bull market and not just a rally in a bear market. If the index can close above 12000 by the end of next week, it would pave the way for 13000 by the end of the first quarter and 13600 by the end of the year.

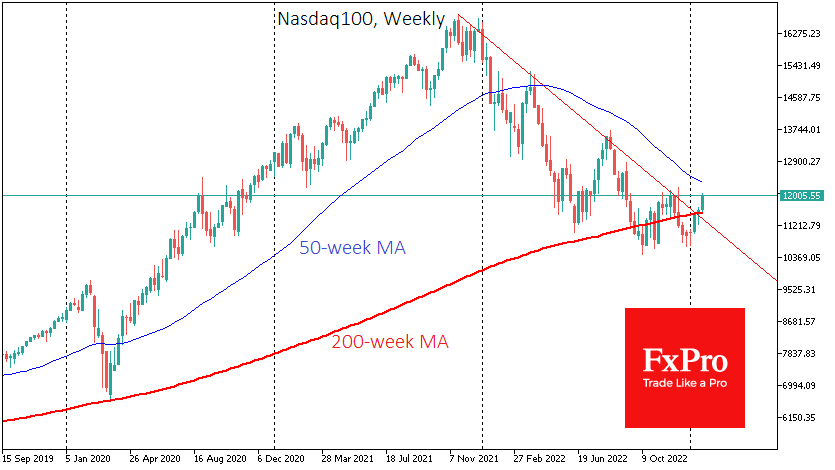
Last week the index closed above the most important long-term trend line (200-week moving average). The price was also above the downside resistance line, which the index had reversed several times last year.
These long-term signals looked rather weak as the move was very formal. But this week, the rally has continued, confirming buyers’ confidence at current levels.
Moreover, yesterday the Nasdaq100 closed above its 200-day moving average, further confirming the long-term trend reversal. As with last week’s close, the excess is nominal, leaving room for doubt.
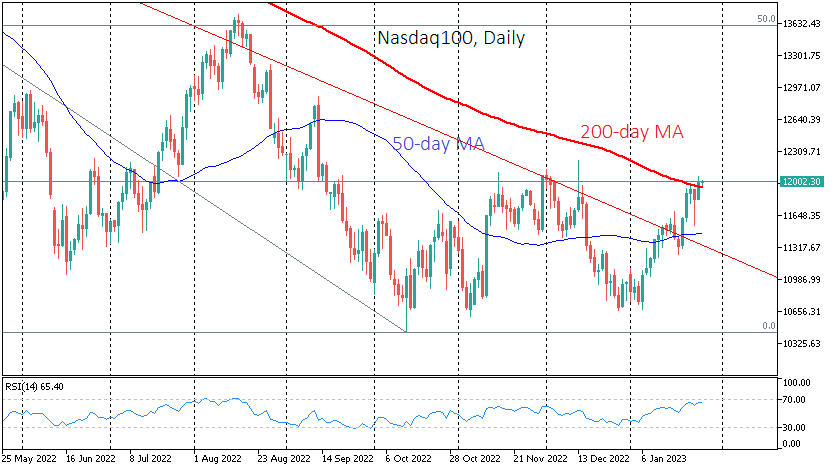
And those doubts have something to fall back on. The index is up around 13% in three weeks, back to the highs of last December, where the gains have slowed considerably: Wednesday’s dip has been bought off, but the swings around 12,000 continue. The 200-day average has been largely breached by the fall.
The index is also close to the over-bought territory on the daily RSI. This indicator is a good predictor of technical corrections, although it sometimes signals too early.
However, our main concern is the extent to which market expectations diverge from the Fed’s rhetoric. The build-up of expectations that the Fed will cut rates this year has been the main driver of growth in the high-tech sector.
But all we hear from officials is a willingness to slow the pace of tightening to 25 basis points at a time, with a further 2-3 hikes. If the official FOMC commentary next Wednesday confirms the Fed’s hawkish stance, we could see a repeat of the reversal that occurred in June and August last year.
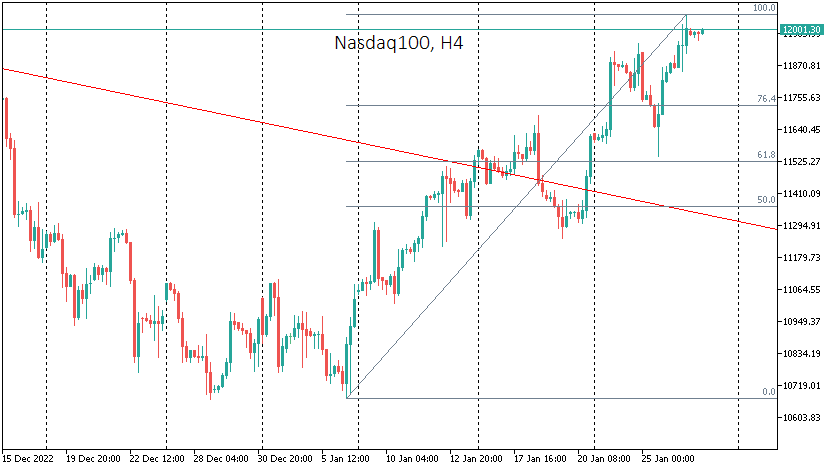
If we are right, the Nasdaq100 could retreat into the 11250-11500 range. The lower boundary of this range is the local lows of the 19th of January, while the upper boundary is the 61.8% retracement of the advance of the 6th of January and the 50-day moving average.
The FxPro Analyst Team