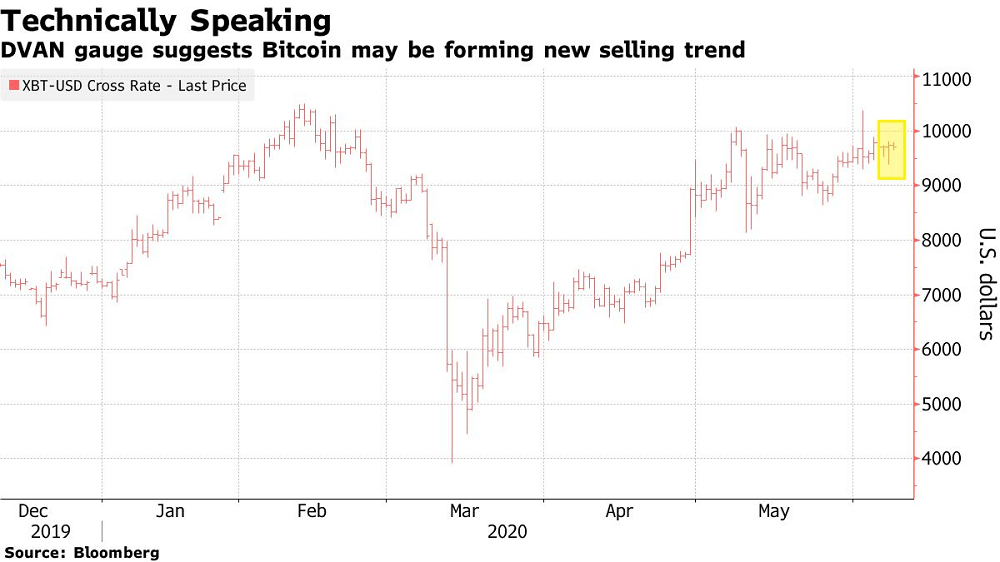
Bitcoin fans have been heartened by its recent rally, but a technical indicator points to a potential slump ahead. Based on the DVAN Buying and Selling Pressure Indicator, which depicts bull/bear trends, Bitcoin fell below the trend line for the first time since late May, suggesting the coin may be forming a new selling pattern. The world’s largest digital token sees resistance at $10,000 and any drop will likely first test $9,500, which would imply a 2% retreat from current levels.

Bitcoin dropped 0.4% as of 11:25 a.m. in New York to trade around $9,678. Peer tokens including Bitcoin Cash and Litecoin also retreated. The Bloomberg Galaxy Crypto Index, which tracks major digital currencies, was down as much as 1.1% at its session low.
Crypto fans have seen prices surge this year thanks to projections that digital tokens can benefit as central banks and governments around the world unleash stimulus measures to shore up listing economies. And while many crypto investors and fans continue to remain bullish given the token’s 35% gain this year, some of Wall Street’s best-known names have also come to embrace it, further buoying sentiment.
“Bitcoin was conceived following the last financial crisis. It will come of age and mature as a result of this financial crisis,” said Meltem Demirors, chief strategy officer at CoinShares. “While the investment community is still mixed in its views on Bitcoin and cryptocurrencies, the trading and infrastructure ecosystem is absolutely booming, and consumer on-ramps continue to grow and evolve.”
Bitcoin’s Recent Rally May Have Run Its Course, Technicals Show, Bloomberg, Jun 8