A look at the difference between halving cycle highs, lows and halving prices delivers huge BTC price targets which their creator cautions are “hopium.” Bitcoin (BTC) needs to hit $340,000 just to match its performance from its last halving cycle, data shows. In a Twitter series on Aug. 20, popular statistics resource ChartsBTC noted that Bitcoin still has huge room for growth at current levels of $11,700.

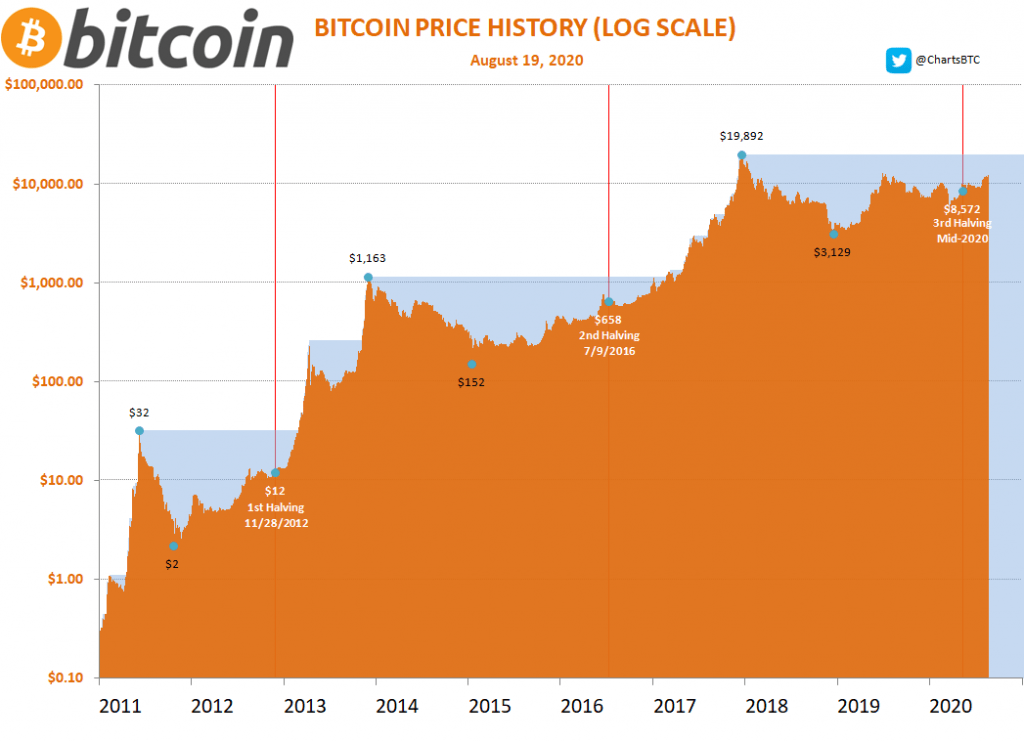
Comparing lows, highs and halving prices from its two previous halving cycles, ChartsBTC put the difference between peaks at 36x for the 2012 cycle and 17x for the 2016 cycle. In order to repeat even the more modest cycle’s success, BTC/USD would have to trade at $340,000. 36x from last cycle’s high — Bitcoin’s all-time record of $20,000 — comes to $720,000.
Comparing cycle lows, the results are even more dramatic — the smallest jump of 130x from the previous cycle would deliver a Bitcoin price of $400,000. Running the same diagnosis for Bitcoin’s price at the time of its halving events, the price target is $250,000. “The multiples from prior cycles applied to the current one arrive at highs between $250k and $1.6M in the next 18 months,” ChartsBTC summarized. The account noted that while the math adds up, there is little evidence which demands that such levels really do appear within the given timeframe. “While this may sound exciting, it’s just hopium,” it added.
Bitcoin Will Hit $340K if BTC Price Repeats 2016 Halving Cycle Pattern, CoinTelegraph, Aug 20