Since May 20 Bitcoin (BTC) price has dropped nearly 10%, shifting traders’ focus from taking out the $10K resistance to now holding above the all-important $8,800 support.
The short-term bearish trend took hold after the top-ranked crypto-asset on CoinMarketCap experienced repeated rejections near the $10K mark, which took the form of higher lows at $9,942, $9,905 and $9,849.

Failure to set a higher high above these levels and the steady loss of momentum eventually caused the price to drop below the bullish pennant and the last two days have seen the bearish move intensify.
For the time being, Bitcoin price continues to find support at the ascending channel trendline but the strength of each bounce from this support is beginning to thin and a number of traders are now calling for a revisit to $7,400-$6,500 if the $8,800-$8,575 support gives out.
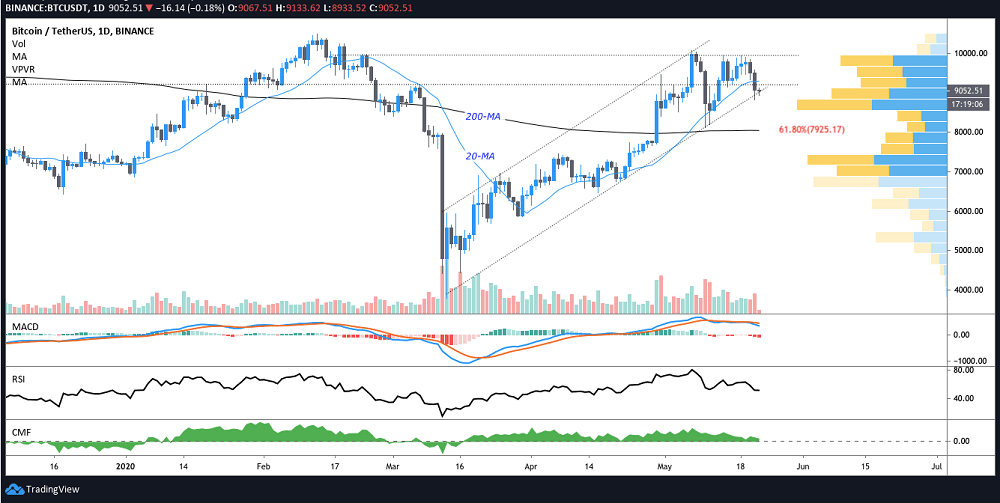
As shown in the daily time frame the price is currently pinned between two high volume VPVR nodes extending from $9,100-$8,575. While the price has dipped below the 20-day moving average for the first time in nine days, Bitcoin is still above the 100 and 200-day moving averages, which are both located near $8,000.
Traders favoring the Bollinger Band indicator will notice that the price dropped below the indicator’s moving average and as selling pressure mounts a drop to the lower band at $8,460 becomes increasingly likely.
Back in April when the price traded below $8,000, many analysts predicted that $8,000 would be a formidable resistance to overcome. But as readers may recall, Bitcoin blasted above this level with ease, meaning the price could also slice through this level during a sharp downside move.
In the event of further action to the downside, traders might reconsider the idea of viewing the 100 and 200 MA at $8,000 as a strong level of support. Given the VPVR volume gap around this price, a correction to $7,400 seems more likely.
Meanwhile, a few traders are already targeting the $6,400 area, citing the formation of an inverse head and shoulders pattern on the weekly timeframe. A drop below the high volume VPVR node at $7,057-$6,385 would complete the right shoulder and the eventual push above the neckline at $9,800 would have traders eyeballing $14,000 as the result of the pattern completing.
Bitcoin Traders Now Eye $6-7Ks After 4 Failed Attempts to Break $10K, CoinTelegraph, May 22