
Bitcoin (BTC) plans to move higher and further squeeze bears in the short term, several price indicators suggest. As the week begins, a group of measurements — some surprisingly accurate historically — are combining to make traders firmly bullish on BTC.


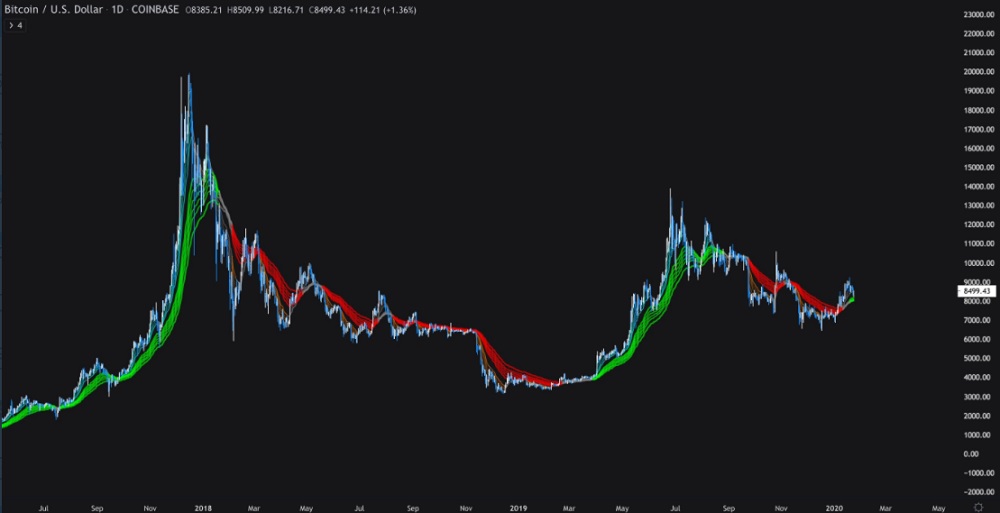
Leading the positive signs is a useful but somewhat forgotten indicator dubbed the Guppy. This is a collection of exponential moving averages which has flashed green on the daily chart for the first time in around 300 days. The interval is significant — the last flip from red to green for Guppy was on April 9, 2019, coinciding with Bitcoin’s rapid rise to highs of $13,800.
Before that, Guppy also turned bullish on Jan. 14, 2018, when Bitcoin briefly rose above $9,000 on the way down from the all-time high a month earlier. A second sign that bullish momentum is building for Bitcoin lies in the so-called Puell Multiple.

Used to identify the cryptocurrency’s price cycles, the tool allows traders to tell from a miner’s perspective when the value of newly-mined Bitcoins is historically too high or too low. Puell spiked during the 2017 highs, bottoming a year later in January 2019 when BTC/USD traded at under $4,000. At present, the indicator suggests Bitcoin is significantly closer to the “too low” area than its lifetime highs.