Bitcoin (BTC) price rallied within $50 of the $11,000 mark after managing a strong breakout above the $10,500 level. For the past 6 months analysts have kept a laser sharp focus on the key level and many forecast that Bitcoin price would soar once the multi-year resistance was obliterated.
Cointelegraph contributor Keith Wareing suggested that Bitcoin price could rapidly move higher as traders’ sentiment will have grown increasingly bullish after the long-term resistance level becomes a new support.
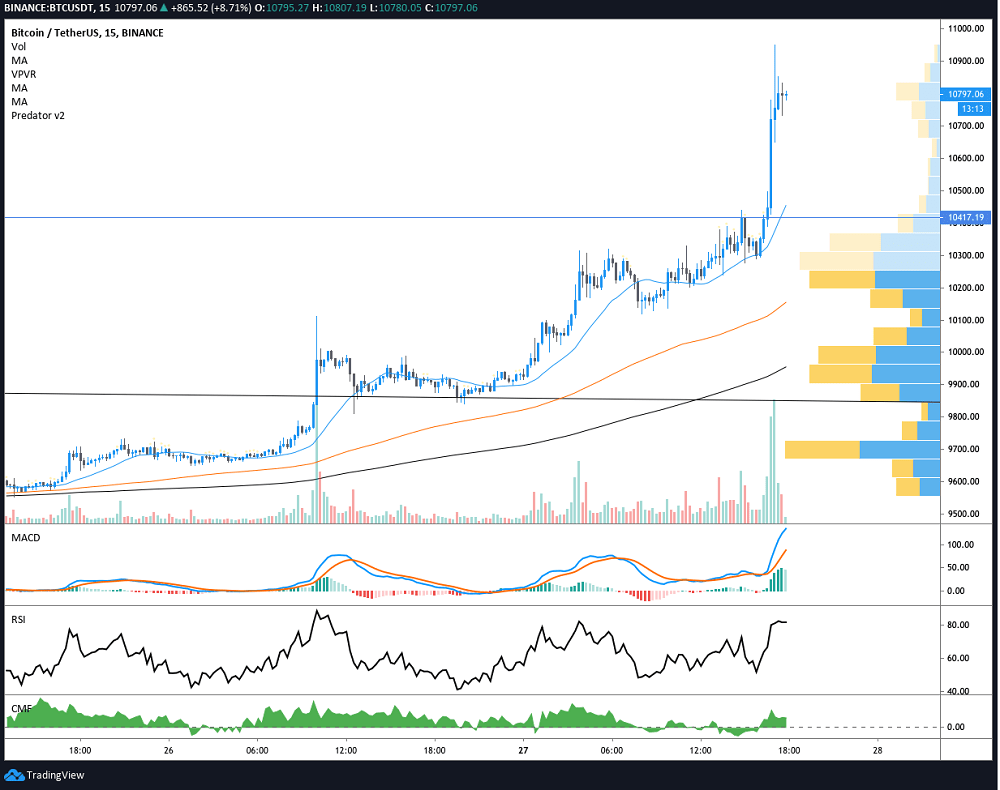
As the 1-hour chart shows, Bitcoin’s recent surge above the long-term descending trendline from the 2017 all-time high, and today’s move above $10,500 were fueled by high volume spikes.
At the time of writing, the moving average convergence divergence and the relative strength index are both in overbought territory, showing bulls are currently in full control.
Typically and overbought RSI and MACD serve as sell signals but Bitcoin’s price history over the years demonstrates that both oscillators can remain deeply oversold as the price surges to new highs.
Bitcoin Price Finally Snaps Multi-Year Downtrend, but Is $20K Now Possible?, CoinTelegraph, Jul 27