

Many instruments – whether its stocks, futures, forex or cryptocurrencies – can experience similar price trends and behaviors during certain months. It is worth reviewing how prices respond given certain months, especially months that involve seasonal changes. September is one of those months with the new Fall season beginning on September 23rd. So it is important to analyze prior Septembers, which we will do now.
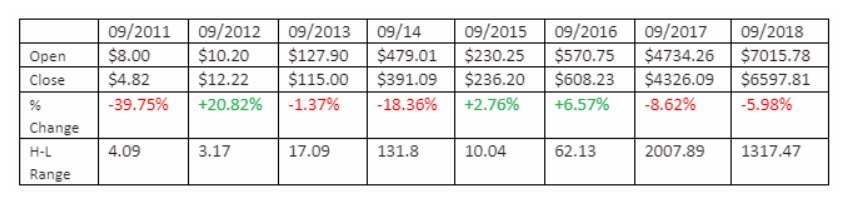

Looking at the tables above, we can garner some idea of Bitcoin’s price action. First, over the past 8-years three years have seen double digit percentage losses (2011, 2012, and 2014). For the last 4-years, Bitcoin has traded the month of September relatively flat. I found the last three years particularly interesting because September was one of the lowest changes from the Open to Close in 2016, 2017 and 2018. It was surprising because there were many months that saw greater than double-digit percentage moves during a period when Bitcoin experience both major bull market moves and the most intense bear market in Bitcoin’s history. Additionally, out of the past 8 Septembers, only one year saw a September open lower than the prior year. That year was in 2015 when Bitcoin opened at $230.25.
So what kind of price action could we expect from Bitcoin in September of 2019? I would predict that we would see a fairly flat market and that any close above or below the open would be limited in the percentage lost or gained. The apex of the current bullish pennant on Bitcoin’s daily chart ends on October 13th, 2019. So a month of tighter and tighter consolidation is certainly probable. Bitcoin has a strong propensity for respecting technical support and resistance levels. I also believe that a flat to neutral close for this year is likely because October is a historically bullish month for Bitcoin. Out of the past 8 years, only two years – 2014 and 2018 – had October months that saw a monthly close below the open. This is important because both 2014 and 2018 were bear market years for Bitcoin.
2019 shows Bitcoin no longer sitting in a bear market, but a bull market. If we consider that Bitcoin will spend all of September consolidating, then that means Bitcoin will have spent 120-days consolidating. If Bitcoin remains in the current trading range for September, then this will be the third consecutive monthly inside bar. If that’s not a sign of an impending and massive move, I don’t know what is. I am predicting and major breakout between mid-September and the beginning of October for Bitcoin.