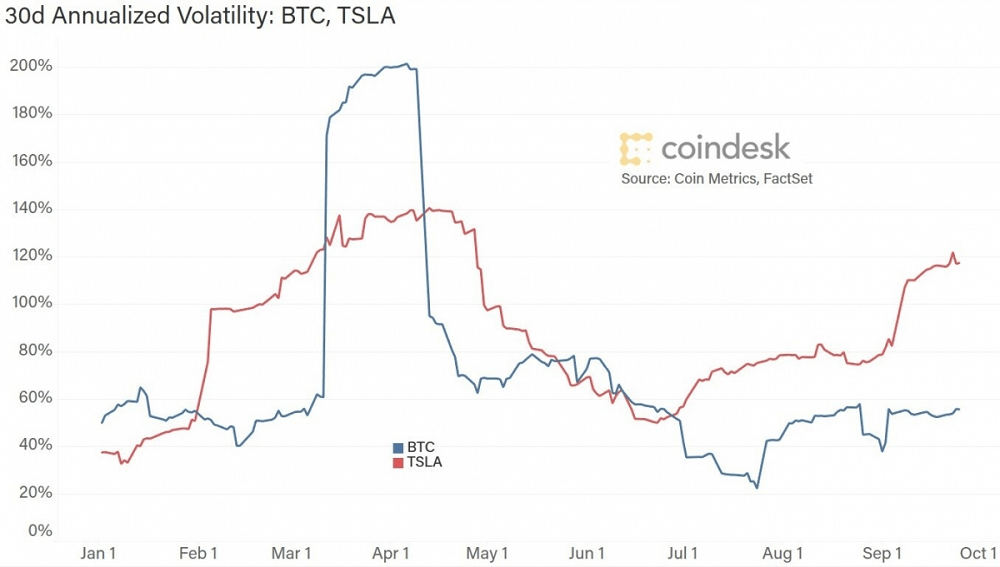
Tesla (TSLA) has been seeing bigger daily percentage moves since the end of June, according to 30-day realized volatility data. Further, the volatility gulf between the two assets has been widening in recent weeks. Bitcoin witnessed a below-1.25% daily move in 14 out of the last 27 days, according to data from TradingView – almost 52% of the time.

However, Tesla only achieved sub-1.25% moves 6% of the time over the same period, data source Skew tweeted early Monday. “People always assume bitcoin is incredibly volatile, but it’s not more volatile than many popular tech stocks,” Skew co-founder and CEO Emmanuel Goh told CoinDesk.
Tesla has seen a month-to-date price decline of 18% – far worse than bitcoin’s 6% drop. Bitcoin’s 30-day historical volatility, which measures the price action realized in the past 30 days, has been flatlined near 55% (annualized) since Sept. 3. Further, its 30-day implied volatility – that is, investors’ expectations of how volatile price will be over the next four weeks – has declined to 44%, the lowest level in nearly two years.
In the past, big moves have been preceded by an implied volatility reading of less than 50%. At press time, the cryptocurrency is currently trading at $10,911, representing an over 2% gain on the day. The weekly chart MACD histogram, an indicator used to identify trend changes and trend strength, has crossed bearish below zero. As such, the cryptocurrency may face some chart-driven selling pressure in the short term.
Bitcoin Has Been Less Volatile Than Tesla Stock for Months, CoinDesk, Sep 28