
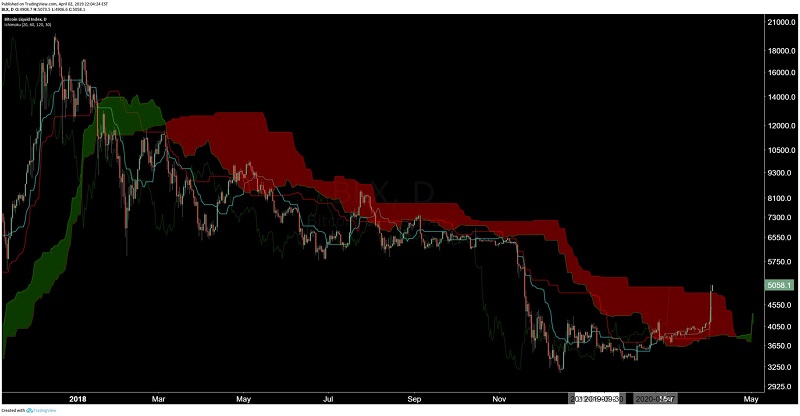
The bitcoin price just accomplished something it failed to do every day for more than a year, and it has speculators foaming at the mouth. For the first time in 442 days, in nearly 15 months, a positive candle of bitcoin was closed on a chart that uses a technical analysis method called the Ichimoku Cloud, a collection of indicators that demonstrate support and resistance levels.
As bitcoin climbed over the $5,000 mark after surpassing a key resistance level at $4,200, it broke out of a 15-month bear trend, which some technical analysts argued was already broken when bitcoin recovered to mid-$4,000.
WHAT’S AHEAD FOR BITCOIN IN 2019?
The bitcoin price rally in the past two days was primarily triggered by three factors:
A short squeeze of $500 million worth of contracts on exchanges like BitMEX
Buyers absorbing massive sell orders in the tune of hundreds of millions of dollars
Lack of resistance above a key resistance level at $4,200
Typically, a strong short-term price movement of bitcoin is followed by a slight retracement, especially if the rally is larger than 10 percent, but the sheer momentum of the cryptocurrency market could allow major assets to continue to perform throughout the weeks to come.
In the near-term, market analyst David Puell suggested that the velocity of bitcoin may lead to the formation of a third cycle during which the dominant cryptocurrency increases in value.