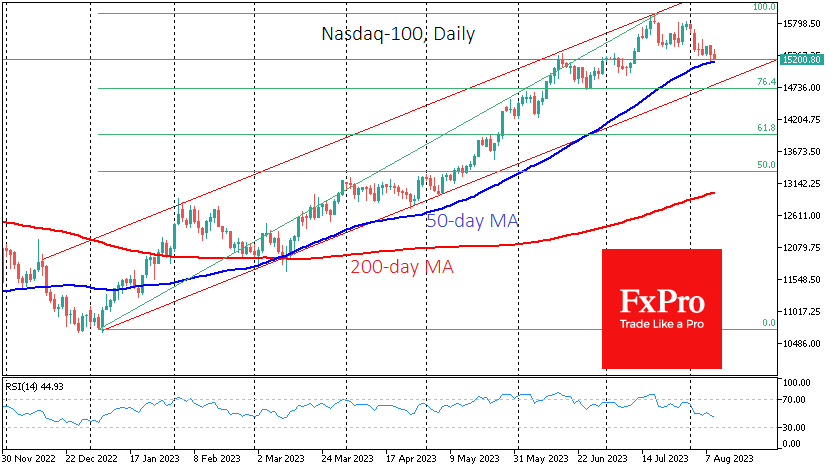
The US Nasdaq-100 lost 1.75% at one point on Tuesday but managed to trim its losses to 0.9% thanks to buying at the end of the session.

The index bounced off its 50-day moving average, which is an essential medium-term trend line, and in the coming days, it is worth paying more attention to the market dynamics around this indicator.
The Nasdaq 100 index broke out of its trough at the start of the year and was firmly above its 50-day moving average by mid-January. Later in March, there was only a tentative attempt to break below this line in a sell-off following a series of bank failures.
But then the markets obeyed an even more crucial technical signal – the “golden cross” – when the 50-day average crossed the 200-day average.
US index futures were higher for most of the day but pared gains in early US trading, raising the question of the relevance of a test of the medium-term uptrend.
A close below 15170 would be a signal of a change in trend to the downside, and a close below 15000 before the end of the week would confirm the change in direction and the start of a correction with the next target at 14700, where 76.5% of the amplitude from the beginning of the year is located. A classic Fibonacci retracement target (61.8%) would be around 14000, an important milestone and pivot level.
The FxPro Analyst Team