Gold lost about 3% on Monday alone and touched $1809 at the start of trading on Tuesday.
Yesterday’s sell-off provided us with four medium-term bearish signals on the daily timeframes.
First, the daily candlestick completely absorbed Friday’s bullish momentum, clearly showing the strength of the bears.

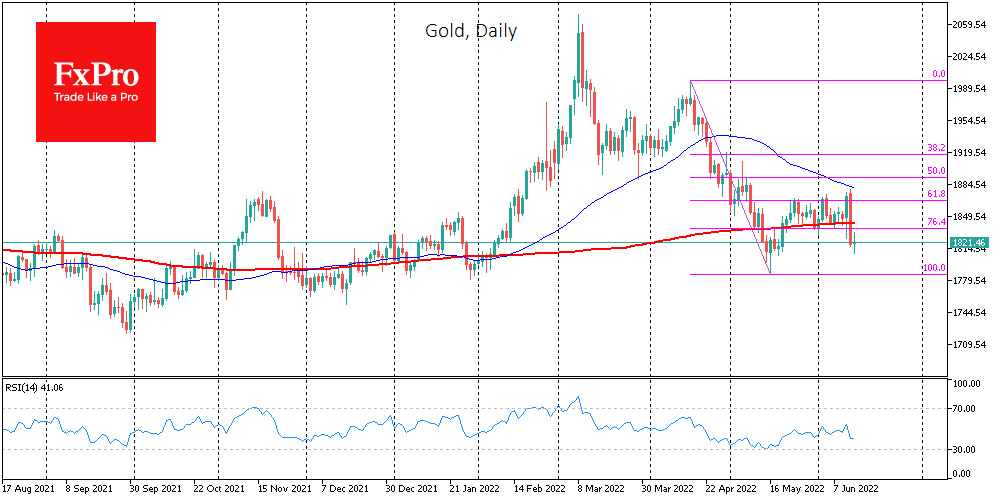
Secondly, gold’s recovery stalled on the approach of the 50-day moving average. The strong reversal indicates that the medium-term trend remains bearish.
Third, in a decisive move, gold has moved below its 200-day moving average, a significant long-term trend signal that works well in gold. A consolidation below this line is a prologue to a further downtrend. Knowing this, investors often increase selling on such a signal, intensifying the fall in the coming days after a consolidation below this line.
Fourth, gold’s recovery this week stalled near the 61.8% Fibonacci retracement level from the April peak to the May low.
Further near-term targets for the bears look like the $1790 area. If risk-off sentiments prevail in the global markets at those levels, gold may quickly return to the area of $1730-1770, where it found buyers’ support in the second half of last year.
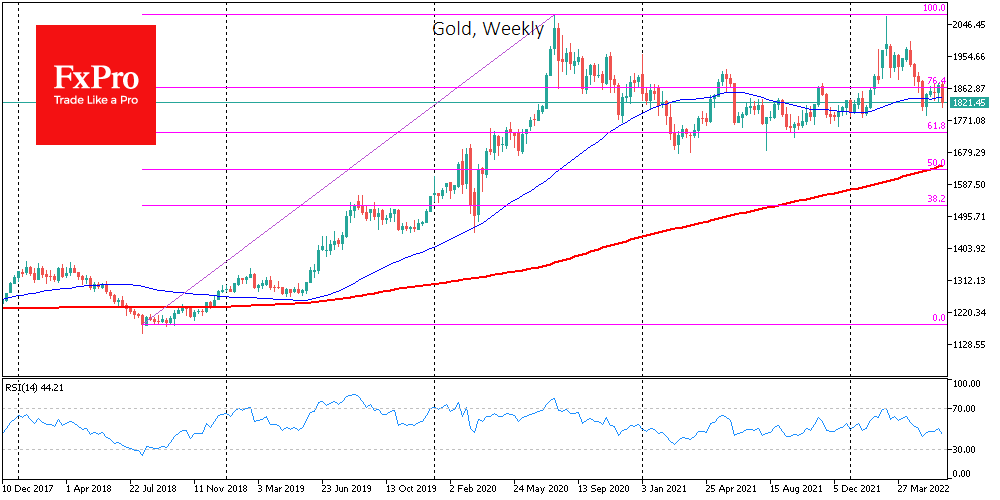
If we move up to the weekly timeframes, a potential final sell-off is seen in the 200-week moving average at $1630, which is also a 50% retracement of the 2018-2020 rise triggered by the soft monetary policy.
The FxPro Analyst Team