Oil remains stubbornly stuck in a sideways range despite the dollar’s rally and other risk assets’ retreat over the past week and a half, with weekly production and commercial inventory data painting a relatively contradictory picture.

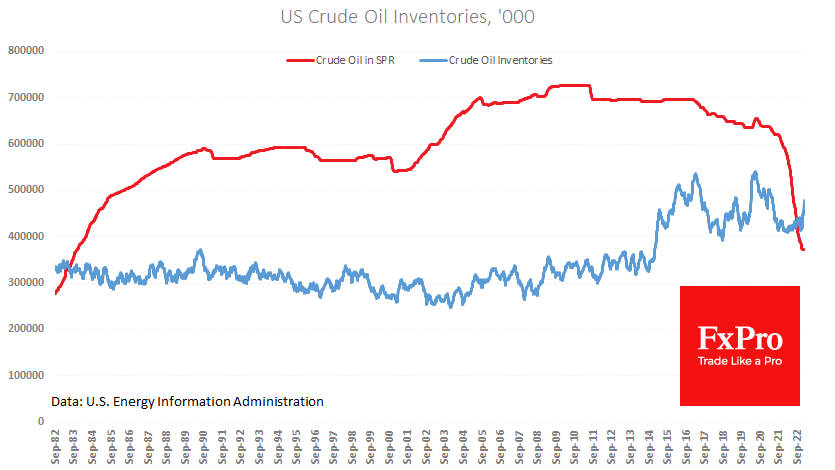
US commercial crude inventories continue to rise steadily, increasing by 7.6m barrels to 479m barrels last week. Commercial inventories have only been higher during the glut of 2016-2017 and the first, most severe cutbacks of 2020. We also pay attention to the accumulation rate, as stocks are now 15.1% higher than one year ago.
The US government has postponed its start to replenish stocks, even though it has hardly sold any oil since the beginning of the year. Price stability seems to force the US to postpone its plans to buy oil in reserve, not to push up prices and inflation further.

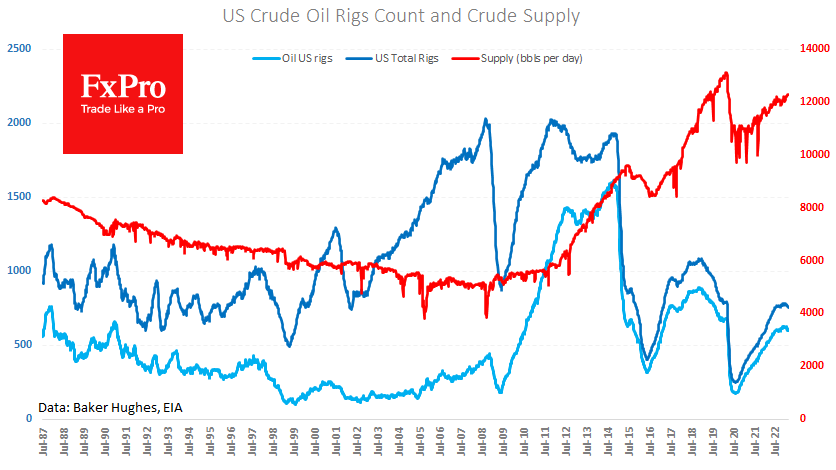
The sharp rise in inventories has been seen while production has stabilised at 12.3m BPD for the past three weeks. Compared to how America ramped up output from mid-2011 to mid-2015 and from October 2016 to March 2020, we now see a creeping increase. Judging by this dynamic, the US is in no hurry to regain the oil market share that Russia and OPEC are losing.
An even more cautious view on the outlook for oil demand suggests a trend in the number of rigs in operation. According to Friday’s Baker Hughes report, the number of oil rigs fell to 600 last week, down slightly from a peak of 627 in early December last year.
The conventional wisdom is that the trend in drilling activity is 6-9 months ahead of the direction in production. Still, a gradual increase in production efficiency can explain the slight current reversal. Only catastrophic collapses in this indicator, such as in 2014-15 and 2020, are worth paying attention to.
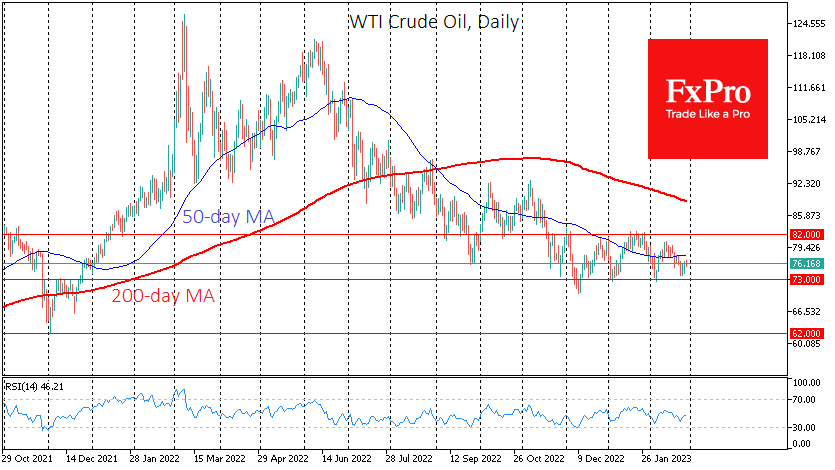
The long-term price trend, in turn, determines the dynamics of drilling activity. Over the past three months, WTI crude oil has been bought on declines towards $73, driven by both OPEC+ production cuts and signs of a stronger economy. However, suppose the Fed does indeed cool the economy to the point of lower demand. In that case, local support is unlikely to withstand selling pressure, opening the way for prices to fall until a change in Fed policy is announced.
The FxPro Analyst Team