Gold returned to monthly highs near $1962 on Tuesday morning after consolidating around the 50-day moving average. All eyes are now on gold’s ability to break away from this line, a medium-term trend indicator.

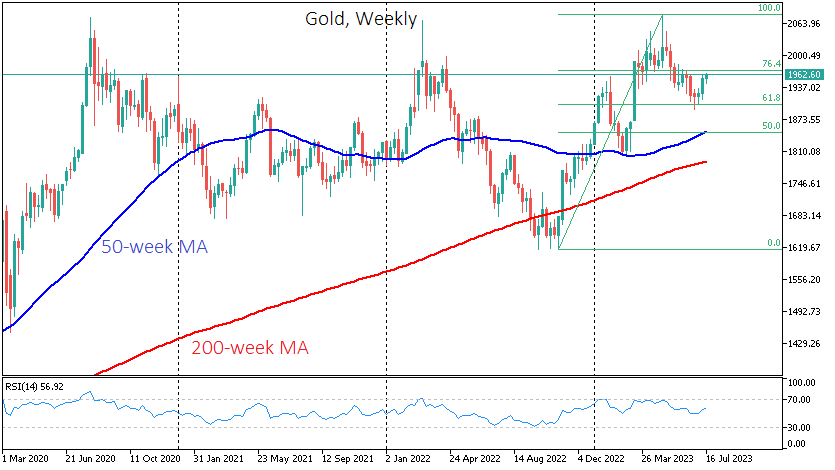
The upward move is well within the pattern forming in the gold market since last September. After forming a solid bottom in September-November the previous year, the price rallied from lows near $1615 to a peak of $2081 in early May.
Within two months, we saw a classic correction with a pullback to 61.8% of the initial move, briefly touching levels below $1900. Gold then reversed to the upside.
Within this long-term pattern, gold could break through the previous highs ($2081) and potentially head towards $2370 (161.8% of the initial move), which could take more than six months.
However, the bears have a good chance of proving their strength and thwarting the upside scenario. The current level delayed gold’s decline in the first half of last month and now acts as an obstacle to further gains.

Separately, we are watching the oversold local dollar. Last week, the weakening of the US currency boosted gold’s gains, but a corrective recovery in the dollar could break gold’s bullish pattern.
A rise in gold above $1970 in the next few days would reduce doubts about the bullish scenario involving a renewal of historical highs. A quick pullback below $1950 and the 50-day moving average would confirm the dominance of a short-term downtrend.
The FxPro Analyst Team