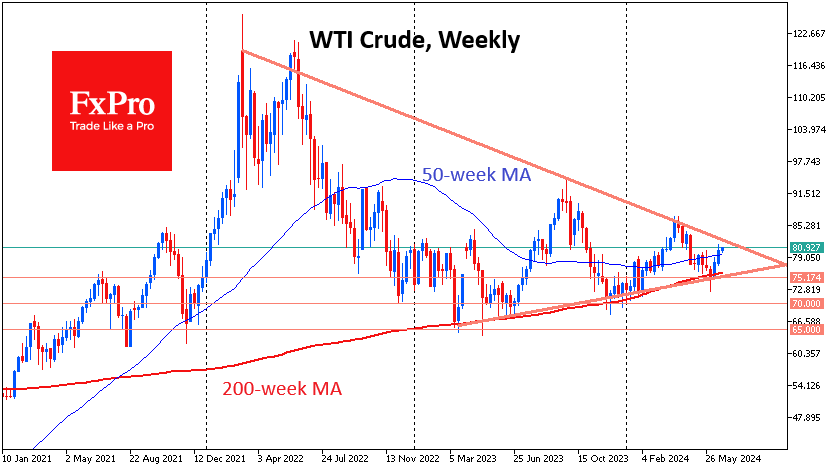
The price of crude Oil rose steadily in the previous fortnight and is starting the new week with a positive trend. This rise emphasises the importance of the 200-week moving average, below which the price has not fallen for a long time for more than three years.

The OPEC+ meeting in early June rattled the bulls’ nerves, briefly pushing the price below this line, but this once again attracted buyers. The 200-week average acts as a long-term trend indicator, marking the average price level over nearly four years—about half of the traditional business cycle. Regular touches of this line raise the question that the world economy is walking on the edge of recession but avoiding it for now.
However, this curve is pointing upwards, having risen 17% since the start of 2023 to $76.2 in WTI and $80 in Brent. These are the highest values since 2016, but far from the $100s that were in Oil’s previous bull cycle, which ended in 2014.
The apathy of US oil producers has characterised this bull cycle. We continue to get data on falling drilling activity from Baker Hughes and stagnant production. According to the latest data, 485 oil rigs were active last week and 588 total (minus 3 and 2 for the week, respectively). These are the lowest values in two and a half years.
A separate report from the Department of Energy shows continued smooth replenishment of the strategic fuel reserve (the highest in 14 months). Commercial stocks are almost in line with last year’s levels after rising since the start of the year.
Production levels have returned to 13.2 million BPD in the previous two weeks after 13 weeks of declines to 13.1 million.
Simply put, US oil producers are satisfied with the status quo and seek to balance production at current prices. This neutral American stance is complemented by the actively bullish stance of OPEC+ countries, which are keen to keep a net deficit in the market, at least in words. At the same time, a downturn in demand in Europe and weakness in China are balancing the situation.
Perhaps only tech analysis will help to wade through the geopolitical twists and turns in Oil. For more than two years, the price has been forming a global triangle with local highs of $120, $94, and $86, and lows of $65, $70, and $75. Now, the price is closer to the previous high, but only its overcoming can signal the final choice of direction. Until then, Oil is within a declining volatility trend with a preferred mean reversion tactic.
The FxPro Analyst Team