Gold is down more than 1% on Wednesday and 5.5% in the last two weeks, failing to find any firm buying support after taking off at the end of September. Declining almost daily over the previous two weeks, it wiped away nearly all its gains of the recent rally, going back to levels of $1630. The technical picture looks contradictory, with something for both bulls and bears.

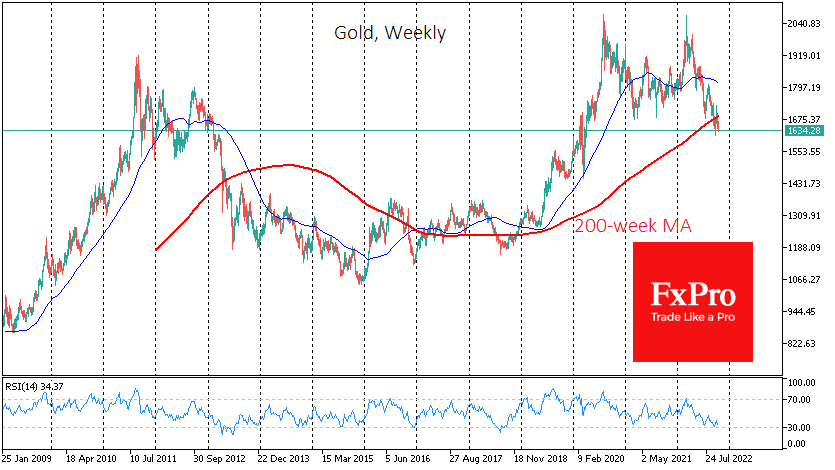
During the sell-off last week, gold returned under the 200-week moving average, signalling that the bears are still in control of the long-term trend in the metal. The last time we saw a similar technical pattern was in 2013. The analogy is reinforced by the fact that there were several years of solid gold price increases in response to the recession, rate cuts and QE. This was followed by a correction and a false attempt to push gold to renewed highs. But the economic slowdown played against the demand for the precious metal.
At that time, a renewed failure under the 200-week mark was followed by an absolute surrender, which took 18% off the price within seven weeks. The bearish trend finally died out two and a half years later.
Despite the frightening similarity in the weekly chart, there are differences from what happened ten years prior. Back then, the price of gold reached the bottom on the day of the first Fed rate hike, an event that did not stop the pressure this time.
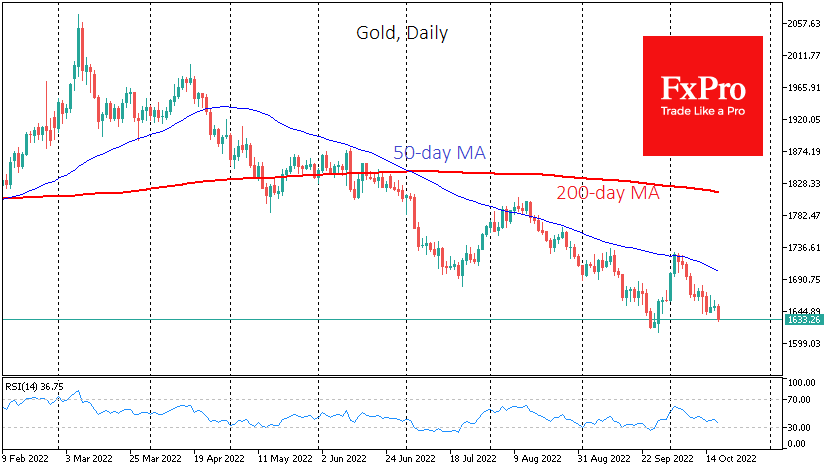
On the daily candlestick charts, the rally in gold was stopped by the 50-day moving average, which has acted as resistance more than once since April of this year. However, the bullish divergence between the price and the RSI remains in force, indicating that the bearish momentum is locally exhausted.
Should gold close this week below its 200-week average, which is now near $1680, the chances of a bearish scenario would increase sharply. In the recent history of free-floating, gold has fallen 18-30% after falling below the 200-week average. Translated to our prices, that implies a downside potential to $1350 or down to $1150, where the first level coincides with the upper bound of the 2013-2018 trading range and the lower level is near the lows of that same prolonged range.
The FxPro Analyst Team