Market volatility is likely to peak this week, setting the stage for the next two to three months. Typically, volatility is synonymous with declines in equity indices, although that’s not entirely accurate.

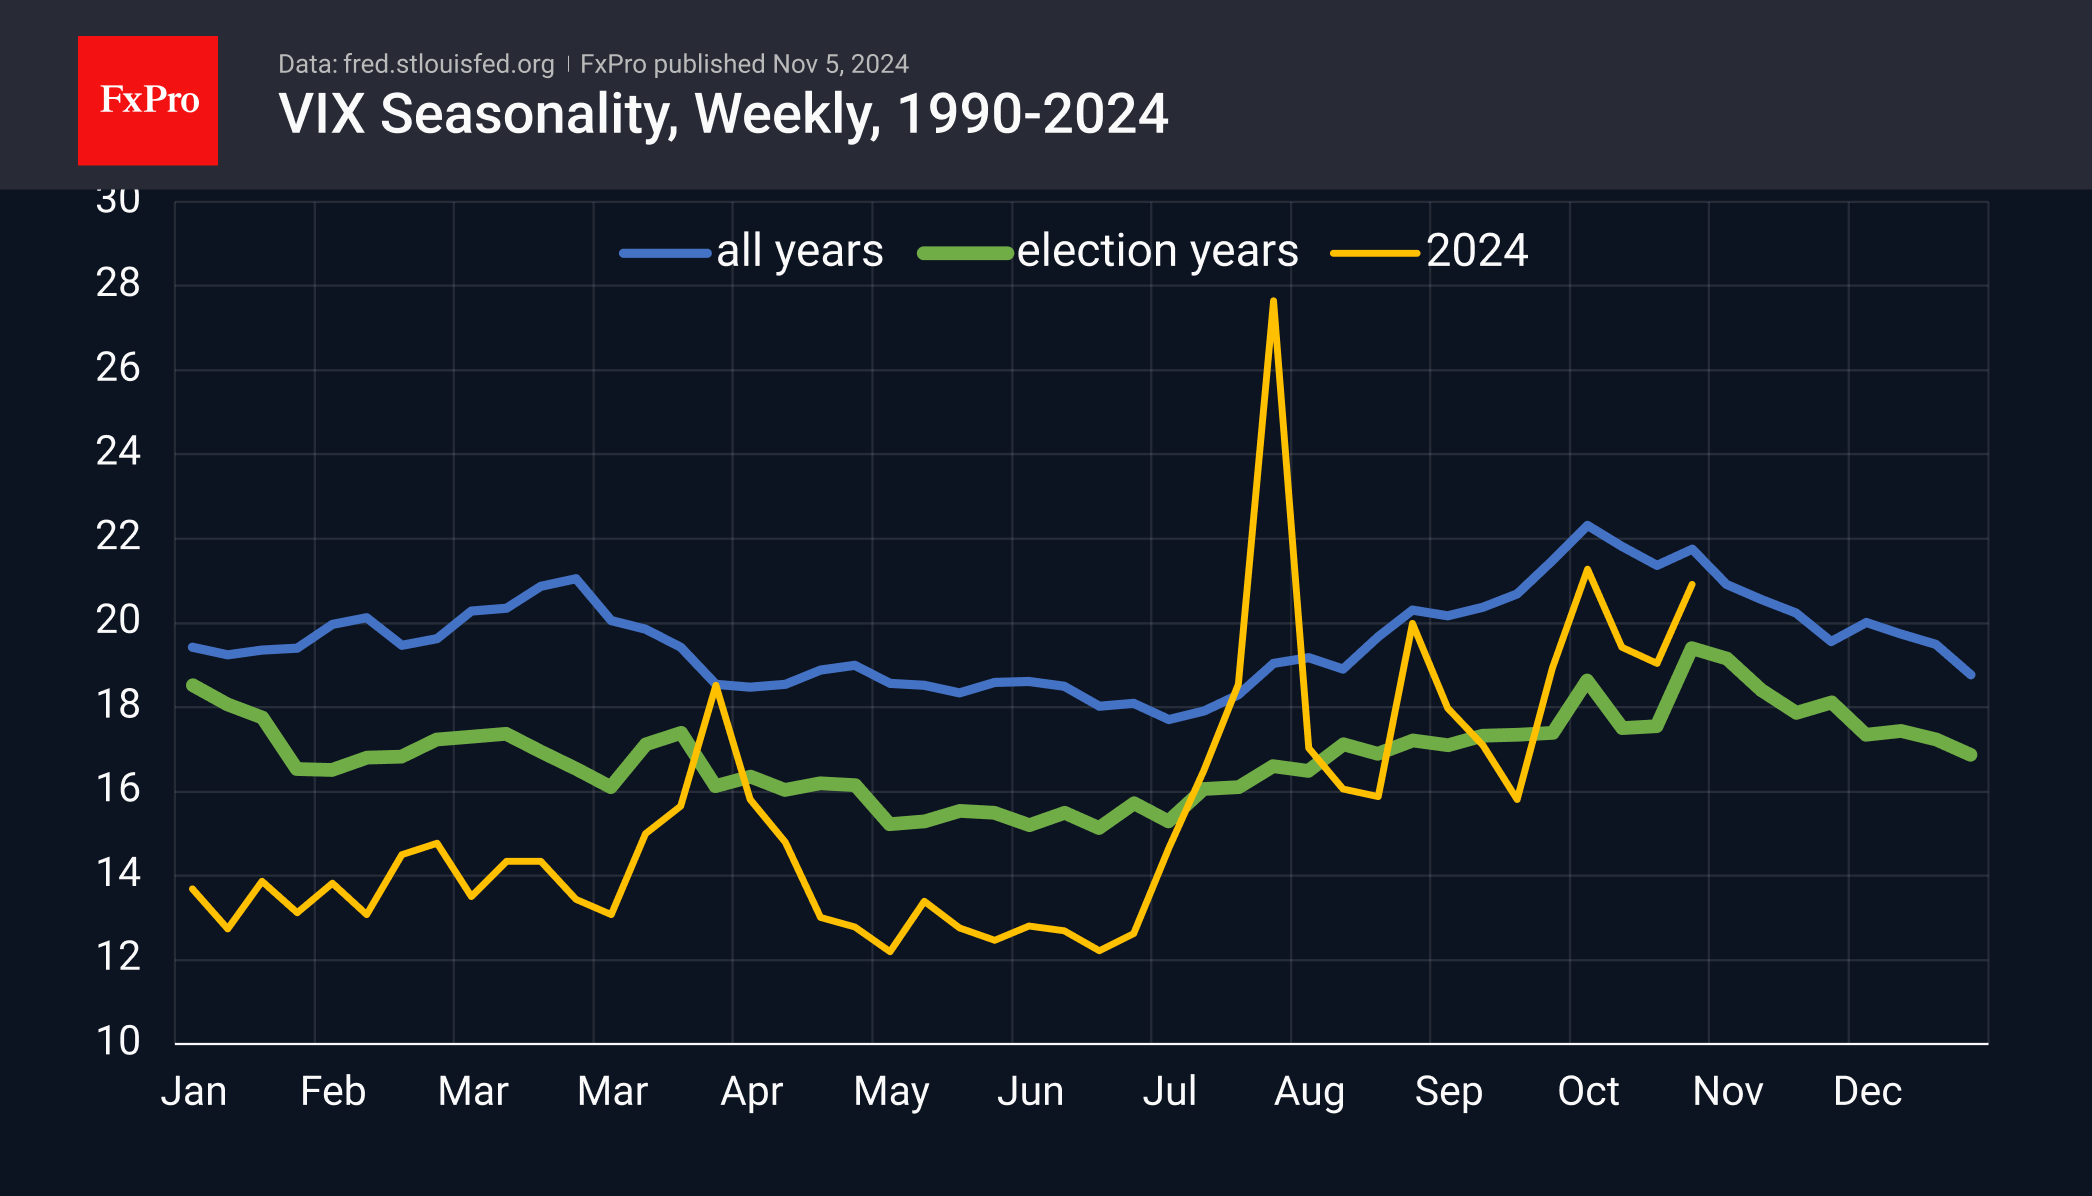
The pattern of market volatility fits well with what we are seeing in the run-up to the election. Nominal values are slightly above average, with the VIX closing last week at 21 versus an average of 19.4. This is due to the tight race between the major candidates. If history is any guide, this week promises to be another volatile one, but further swings will be downward, meaning that trends will stabilise.
For the stock market, a drop in the VIX is often associated with a bullish trend. This, in turn, is more likely to coincide with a smooth decline in the USD as investors choose riskier assets and trade and budget deficits contribute to a weaker USD.
The end of 2016 was an important exception, as the USD and the US market rose in sync while the volatility index fell.
From a technical point of view, it is also interesting to note that the S&P500 has retreated 3% from its highs in the last two weeks, settling near the 50-day moving average and finding support on dips below 5700, which was also the local low in October.
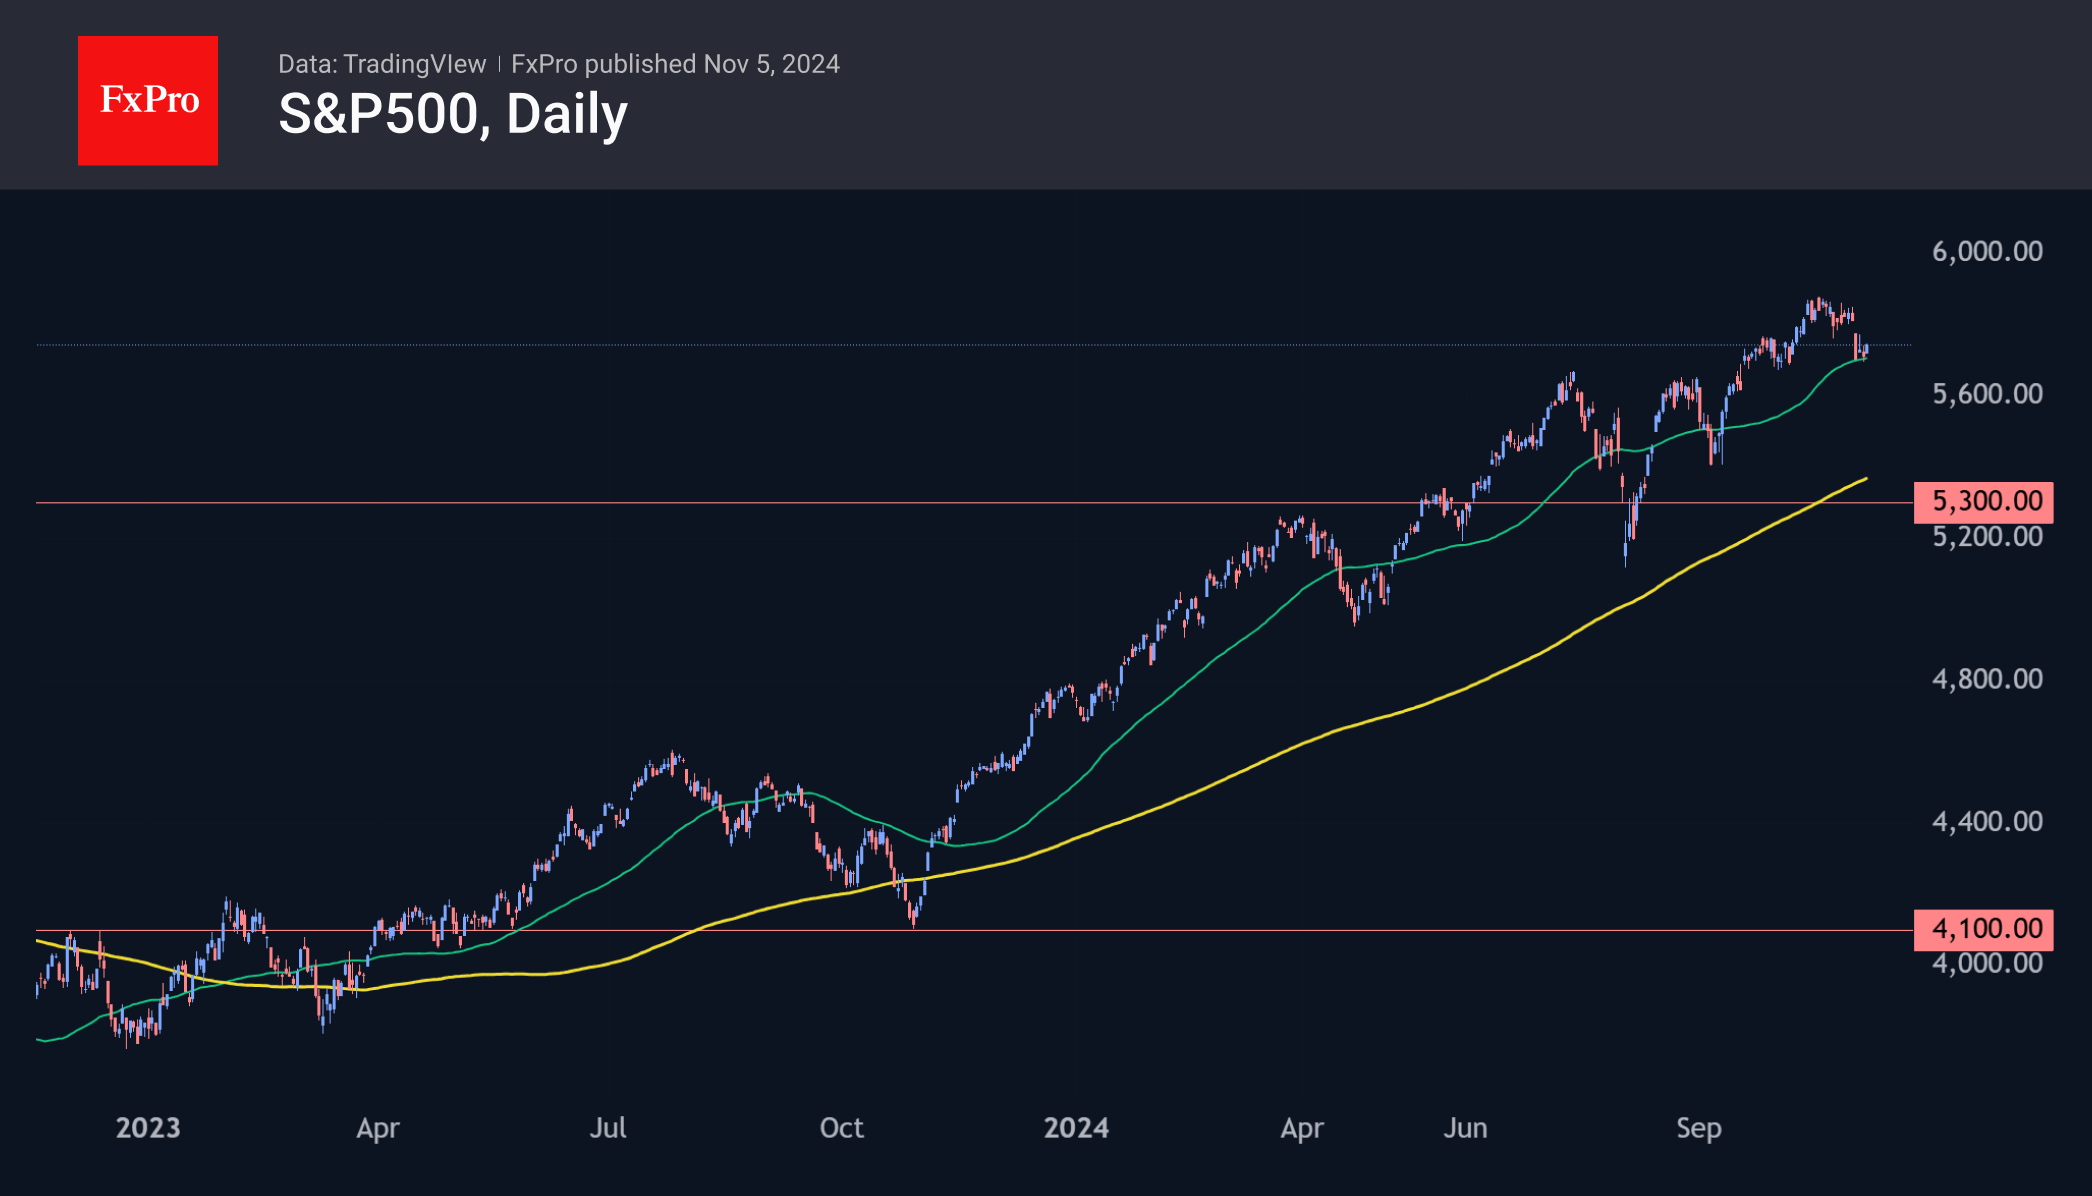
Technically, the short-term picture looks very bullish, but this is precisely the time when fundamentals come to the forefront. A sharp break below 5700 could be the first sign of buyer capitulation, triggering a more global correction to 5300 or even a bear market with the potential for a decline to the 4100–4500 area in the 9–12-month timeframe. This is an alternative scenario, somewhat contrary to the average patterns we see at this time of year. However, we will not be able to rule it out until the S&P500 clears 5900 completely.
The FxPro Analyst Team