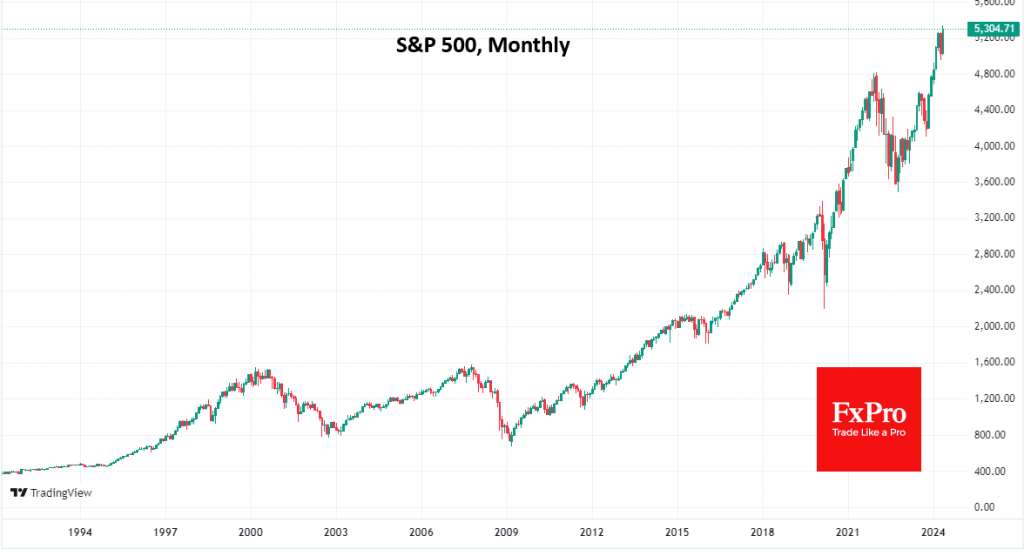
The Nasdaq100 and S&P500 indices are showing measured gains, while volatility has declined to levels last seen in January 2020. Many traders are looking at this volatility compression as the calm before the storm, something we saw just over four years ago. The prudent strategy for this market is to “buy the dip.” A sustained rise in the VIX above 20 would signal the start of a correction.

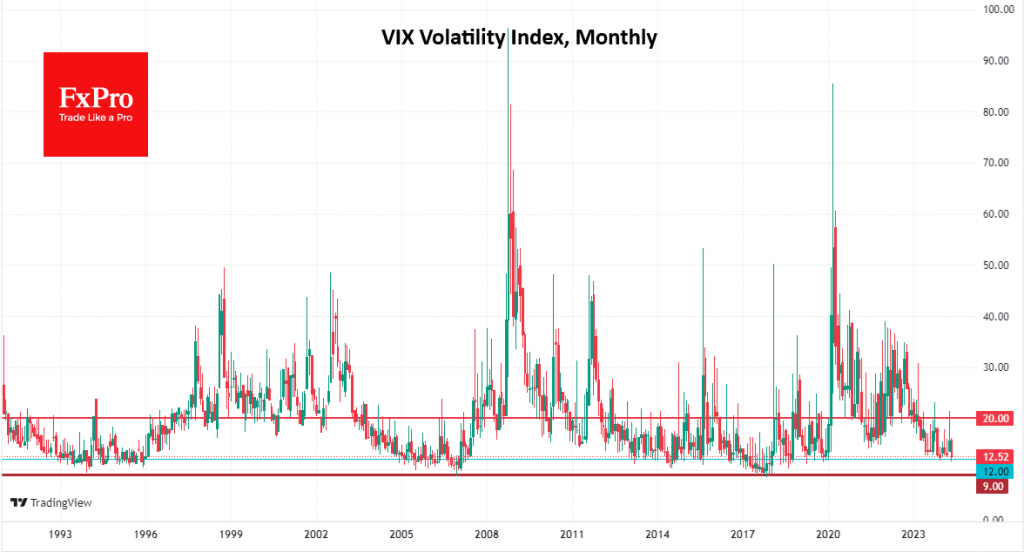
However, history suggests that a VIX decline alone is not enough to predict a market reversal. From May 2018 to January 2020, the index dipped below 12 several times. During that time, the S&P500 index added over 30%, and a “buy on downturns” strategy would have provided even more attractive returns.
Moreover, the VIX spent almost all of 2017 below 12, during which time the S&P500 added 20%, against a long-term average of 10-11%. In this episode, the market didn’t encounter a powerful correction until early 2018, and the index returned to growth from higher levels than before the lull.
The same can be said for earlier periods: a VIX pullback into the 10-12 area is often followed by a transition to accelerated market growth, often with shallow corrections.

The distinction between short-term pullbacks and the start of a deeper correction can be made roughly through the 20 level of the VIX. Continued declines in equities and further increases in volatility mean the market switches into “fear” mode. In this case, but not before, it is worth changing tactics from “buying on downturns” to selling on growth.
In October 2023 and April 2024, the VIX temporarily rose above 20 but quickly pulled back, giving false early signals.
If the VIX continues to decline further, we will only get an “irrational optimism” signal when it drops below 9, but even then, it could be months before the S&P500 and Nasdaq100 reverse.
The FxPro Analyst Team