Gold has been under consistent selling pressure since the end of October, as investors take profits following a prolonged rally. This week alone, gold prices have fallen nearly 5%, marking the steepest weekly decline in almost three years. From its peak, the metal has now lost over $250 or approximately 9%, making this the most sustained downturn since the start of the month.

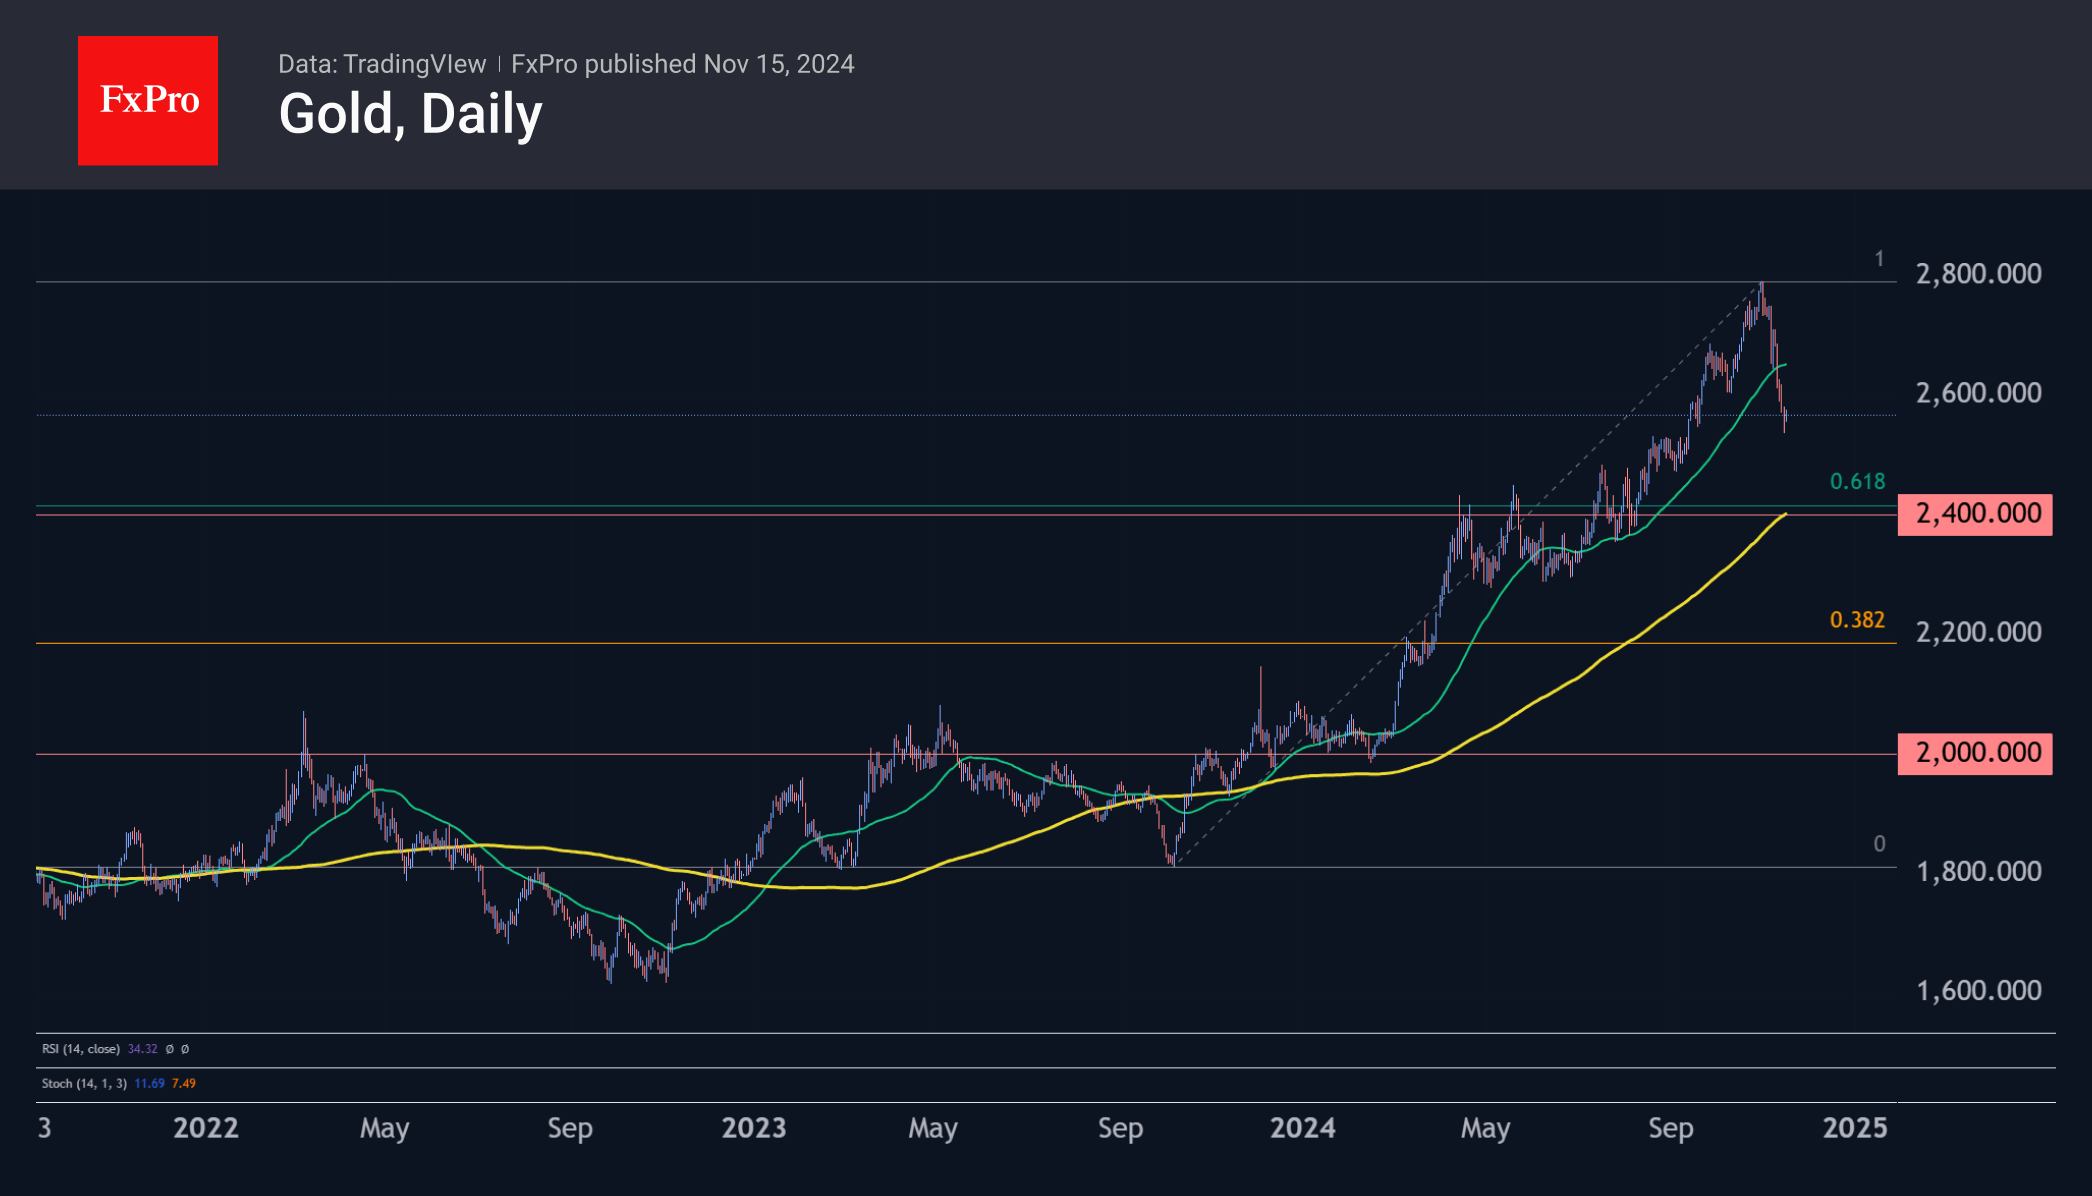
Despite the sharp pullback, gold’s recent rally since last October means that even a drop to $2,400 would represent only a correction, bringing the price back to the 200-day moving average. At the current pace of decline, gold could reach this level before the end of the year.
Technical Analysis
On the weekly charts, a significant bearish signal has emerged: a sharp drop after gold exited the overbought zone, accompanied by the RSI (Relative Strength Index) turning down from levels above 80. This kind of reversal at extreme levels often signals a shift in momentum.
To understand the implications, we can look to historical precedents. The last two instances of a sharp bearish reversal from overbought conditions at all-time highs occurred in 2009 and 2011:
- 2009: Gold experienced a 15% peak-to-trough loss before renewed buying pushed the price to fresh all-time highs. This bull market lasted nearly two years, with only brief pauses.
- 2011: The initial drop in momentum was almost 20%. While gold rebounded 17% afterwards, the bull market’s backbone had already broken. Over the next four years, gold lost 45% of its peak value.

In both cases, the 50-week moving average served as a key medium-term support level during the sell-offs. Currently, this moving average is at $2,330 but is trending upward and could reach $2,400 by the end of the year. A decisive break below this level may trigger an even deeper decline.
The FxPro Analyst Team