Dollar
The dollar spent the week in a quiet mode, but persistent purchases are noticeable on short-term charts. This behaviour is characteristic of large players who gradually pick up the depreciated asset after the downturn, seeking not to move the market at this stage. The rise in US and European index prices and the pressure on gold suggest that we are seeing a return of capital to the US markets. It remains to be seen if this is a recovery from the shock or a temporary respite.

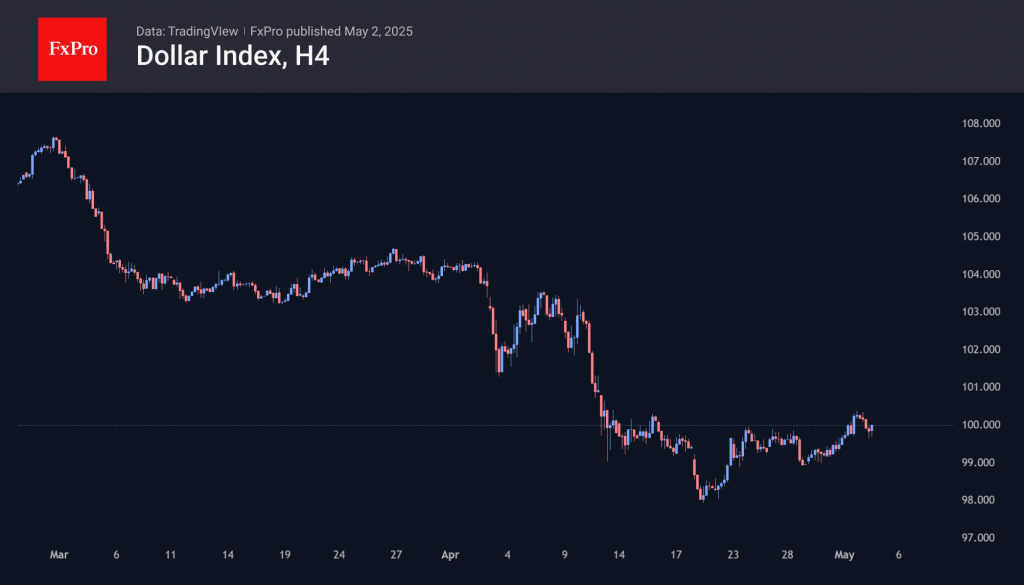
The dollar’s decline since the beginning of the year has created an oversold scale from which rebounds or extended periods of consolidation historically follow. However, our analysis also shows that a new wave of declines usually follows an initial bounce. It is usually less intense but still strong enough to push the rate to new lows.
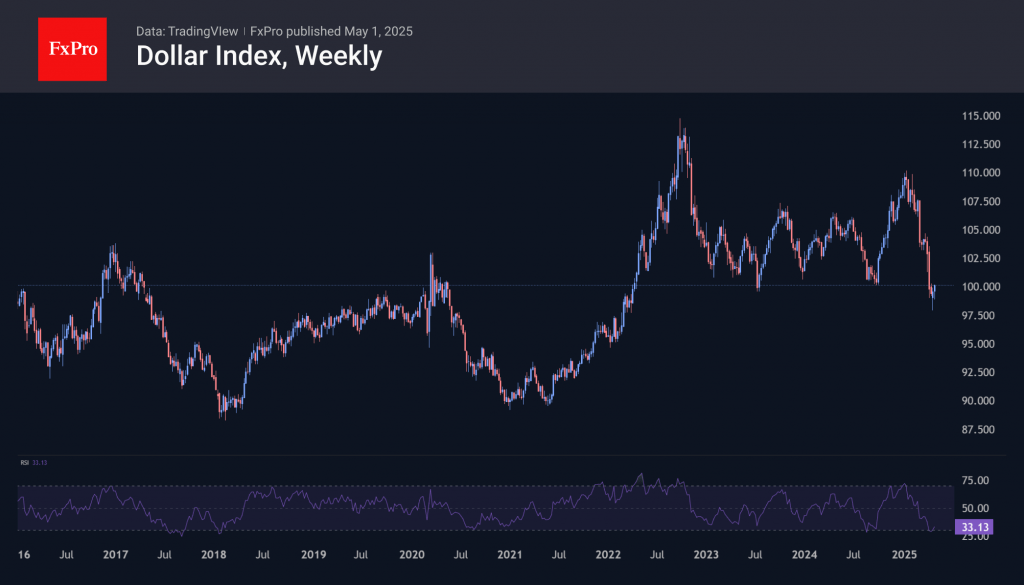
A straightforward strategy is to look for divergence between the RSI and price on weekly timeframes. A buy signal occurs when the price forms a lower local low while the Relative Strength Index forms a higher low.
Indices
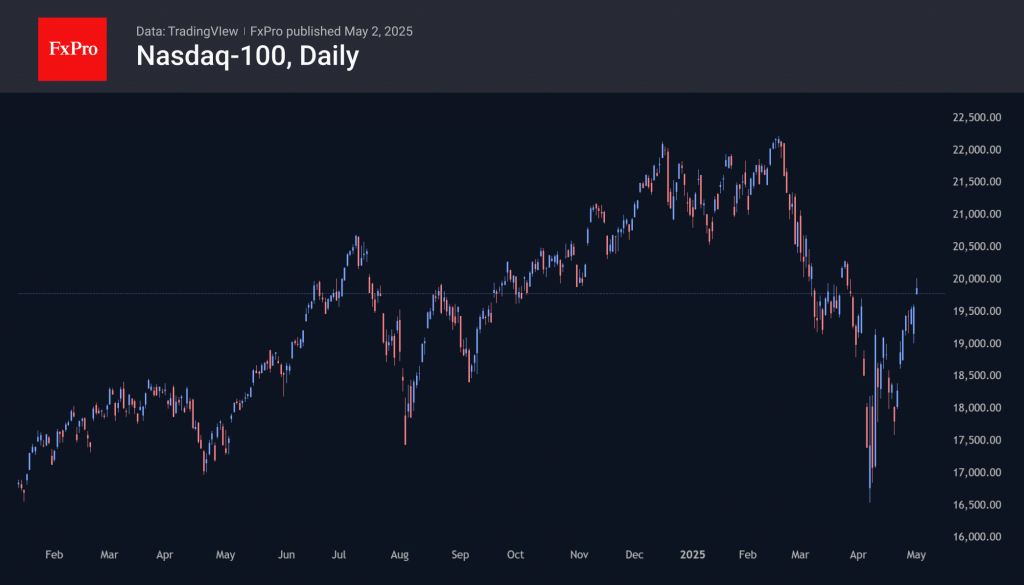
US indices rose for the second week in a row, with the Nasdaq100 up more than 3% and the S&P500 around 2.5%. Wednesday proved to be a watershed day, with a 2.5% intraday dip towards the end of the day redeemed by a 4.3% rally over seven hours. The decline was driven by headlines reporting a contraction in the U.S. economy during the first quarter — widely viewed as the first alarming sign of the trade wars’ impact.
The trade wars did affect these indices, but in a slightly different way. US buyers sharply increased imports, the cost of which reduced GDP. This has been the main negative driver. The other force was the reduction in government spending—something Elon Musk and his DOGE had a hand in. In other words, the data is not as bad as it seemed at the outset.
On the bullish side, strong earnings reports from major companies helped lift the market. Tech giants like Microsoft and Meta saw their shares rise by 8.3% and 6%, respectively, following their quarterly results — pushing the Nasdaq 100 closer to 20,000 and the S&P 500 near 5,600.
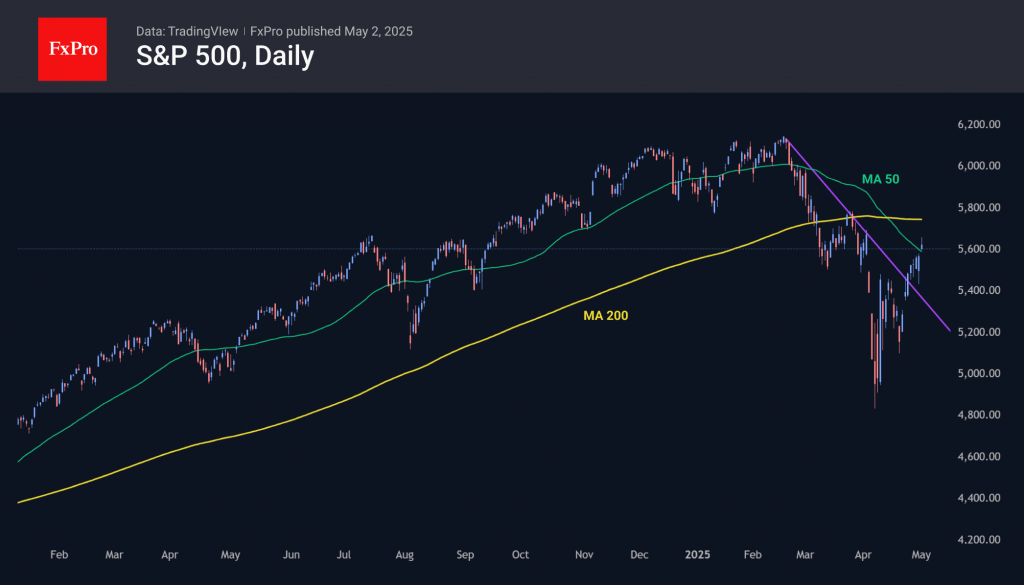
The S&P 500 has decisively broken the downward resistance line that had been in place since February. Following a 9% rally over the past eight sessions, it is now consolidating above its 50-day moving average.
The FxPro Analyst Team