Categories: Crypto Review

Bit-comment: Bitcoin still don’t get a help

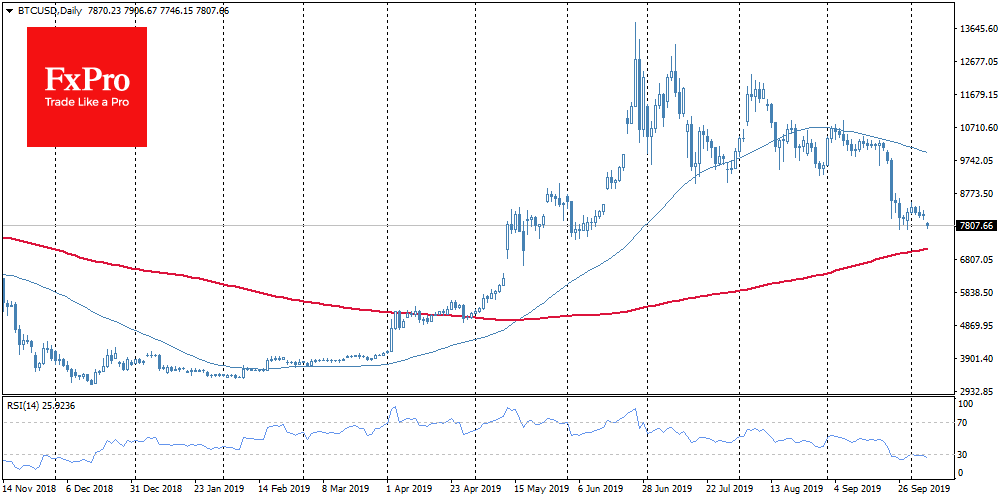
Bitcoin starts the week with a decline below the round 8K level and trades around $7,800 by 9 am.

Bitcoin is slowly but surely “moves south”. With the asset price decline, the trading volume has grown by almost 15% on the last day. A higher trading volumes amid price decline often considers as bad sign for near-term price dynamics.

The decline occurs at the moment when the GTI Global Strength Indicator indicator has issued a signal to buy Bitcoin for the first time since December. Thus, it turns out that it is $8K that can become the starting point of a new rebound. However, we are now seeing a different picture. The Bitcoin’s greed and fear index stood at 27 at the beginning of the week, rushing in the direction of fear. This drop may indicate a further decline in price and an increasingly appropriate time to buy an asset at a discount. Buyers are likely focused on the fact that Bitcoin got support at current levels at the end of September and in June. RSI on the daily charts continues to cruise around the area below 30, interrupting hopes for a rebound.

The FxPro Analyst Team
The FxPro Analyst Team

Our team consists of financial market experts. Our dedicated professionals prepare reviews on the foreign exchange market situation, Crude Oil, Gold and Stock Indices. All the analysts are regularly published in the world leading economic media.

Share
Published by
The FxPro Analyst Team

Recent Posts

GBPUSD Wave Analysis 14 November 2024

- GBPUSD reversed from strong support level 1.2665 - Likely to rise to resistance level…

13 hours ago

USDCAD Wave Analysis 14 November 2024

- USDCAD broke resistance level 1.3950 - Likely to rise to resistance level 1.4050 USDCAD…

13 hours ago

The dollar has reached range limits

The US dollar has strengthened, reaching the upper boundary of its trading range. The British…

15 hours ago

Crypto: Tug-of-war at new altitude

Cryptocurrencies continued to surge, pushing the total cap to $3 trillion. Bitcoin has gained nearly…

16 hours ago

USDJPY Wave Analysis 13 November 2024

- USDJPY broke key resistance level 154.70 - Likely to rise to resistance level 157.20…

1 day ago

USDJPY Wave Analysis 13 November 2024

- USDJPY broke key resistance level 154.70 - Likely to rise to resistance level 157.20…

1 day ago

This website uses cookies