Categories: Trading Updates

NZDCAD Wave Analysis – 19 October, 2021

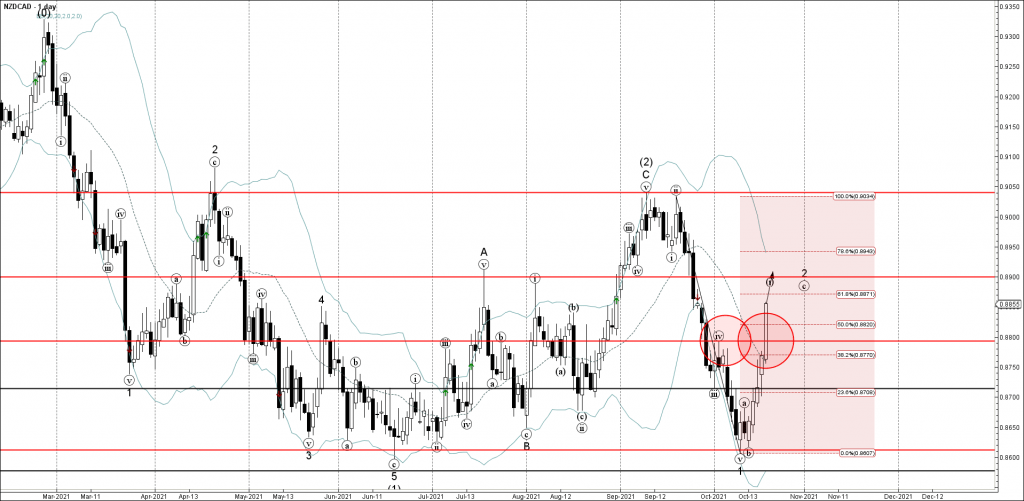
• NZDCAD broke resistance area

• Likely to rise to resistance level 0.8900

NZDCAD currency pair earlier broke the resistance area lying between the resistance level 0.8800 (which stopped the previous minor correction (iv) at the start of October) and the 38.2% Fibonacci correction of the downward impulse from September.

The breakout of this resistance area accelerated the active impulse wave (c) of the long-term ABC correction 2 from the start of October.

NZDCAD can be expected to rise further toward the next resistance level 0.8900 (target price for the completion of the active ABC correction 2).

new zeala
The FxPro Tech Analysis Team

The FxPro technical experts prepare a daily analysis of the most active currency pairs (majors, crosses, exotics) and commodities. Selected instruments are reviewed on daily trends (D1, H4), using the active Elliott Wave setups, Japanese candlesticks, indicators, and support/resistance levels.

Share
Published by
The FxPro Tech Analysis Team
Tags: NZDCAD

Recent Posts

Brent Crude oil Wave Analysis – 13 January 2026

Brent Crude oil ⬆️ Buy - Brent Crude oil rising inside impulse wave c -…

5 hours ago

USDJPY Wave Analysis – 13 January 2026

USDJPY ⬆️ Buy - USDJPY broke resistance area - Likely to rise to resistance level…

5 hours ago

Exxon Mobil Wave Analysis – 13 January 2026

Exxon Mobil ⬆️ Buy - Exxon Mobil broke resistance level 125.60 - Likely to rise…

5 hours ago

BNB Wave Analysis – 13 January 2026

Brent Crude oil ⬆️ Buy - BNB broke out of sideways price range - Likely…

5 hours ago

A slightly weaker CPI was not enough to break through the highs

US CPI data a bit softer than forecasts, sparking brief market optimism, but resistance remains.…

11 hours ago

Pro News Flash: Global Tensions Fuel a Fresh Oil Rally

🛢️ Oil prices are finding fresh strength as geopolitical tensions in the Middle East reignite…

11 hours ago

This website uses cookies