Categories: Technical analysis

WTI Wave Analysis – 8 April 2025

WTI: ⬇️ Sell

– WTI broke the long-term support zone

– Likely to fall to support level 55.00

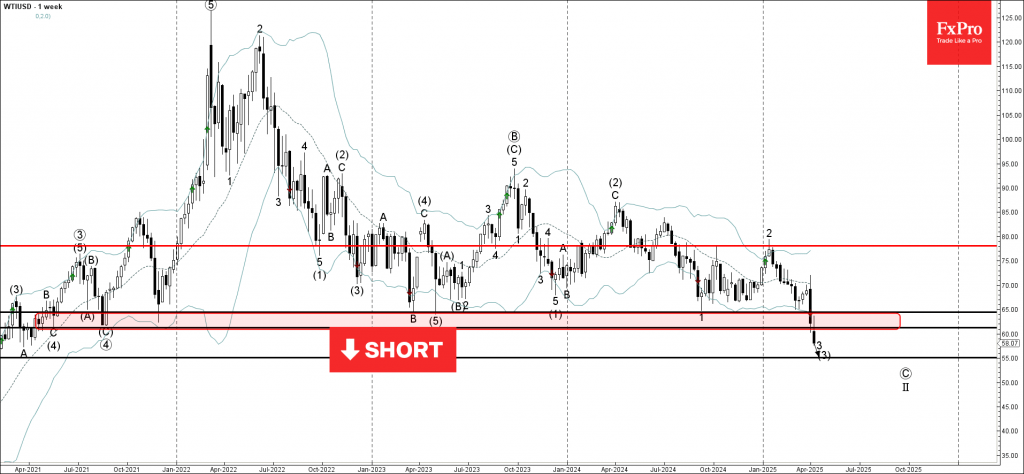
WTI crude oil recently broke the long-term support zone set between the support levels 60.00 and 65.00. This support zone has stopped all downward corrections from the middle of 2021.

The breakout of this support zone accelerated the active downward impulse wave 3, which belongs to the intermediate impulse wave (3) from the start of 2024.

Given the strong downtrend seen on the weekly WTI charts, WTI crude oil can be expected to fall to the next support level 55.00, the target price for the completion of the active impulse wave (3).

The FxPro Tech Analysis Team

The FxPro technical experts prepare a daily analysis of the most active currency pairs (majors, crosses, exotics) and commodities. Selected instruments are reviewed on daily trends (D1, H4), using the active Elliott Wave setups, Japanese candlesticks, indicators, and support/resistance levels.

Share
Published by
The FxPro Tech Analysis Team
Tags: wti

Recent Posts

Gold Wave Analysis – 12 December 2025

Gold: ⬇️ Sell - Gold reversed from strong resistance level 4350.00 - Likely to fall to…

2 days ago

EURGBP Wave Analysis – 12 December 2025

EURGBP: ⬆️ Buy - EURGBP reversed from support zone - Likely to rise to resistance level…

2 days ago

Filecoin Wave Analysis – 12 December 2025

Filecoin: ⬇️ Sell - Filecoin broke key support level 1.435 - Likely to fall to support…

2 days ago

Ethereum Wave Analysis – 12 December 2025

Ethereum: ⬇️ Sell - Ethereum reversed from resistance level 3400.00 - Likely to fall to support…

2 days ago

Pro News Weekly: Global Markets at a Turning Point

Welcome to Pro News Weekly! Here’s what is moving the markets: 💵 The Fed fails…

3 days ago

Crypto: slight rebound within a bear market

Crypto rebounds slightly in a bear market; resistance holds, optimism rises, but the outlook remains…

3 days ago

This website uses cookies