Categories: Technical analysis

WTI Wave Analysis – 7 May, 2020

  • WTI broke the resistance area
  • Likely to rise to 28.90

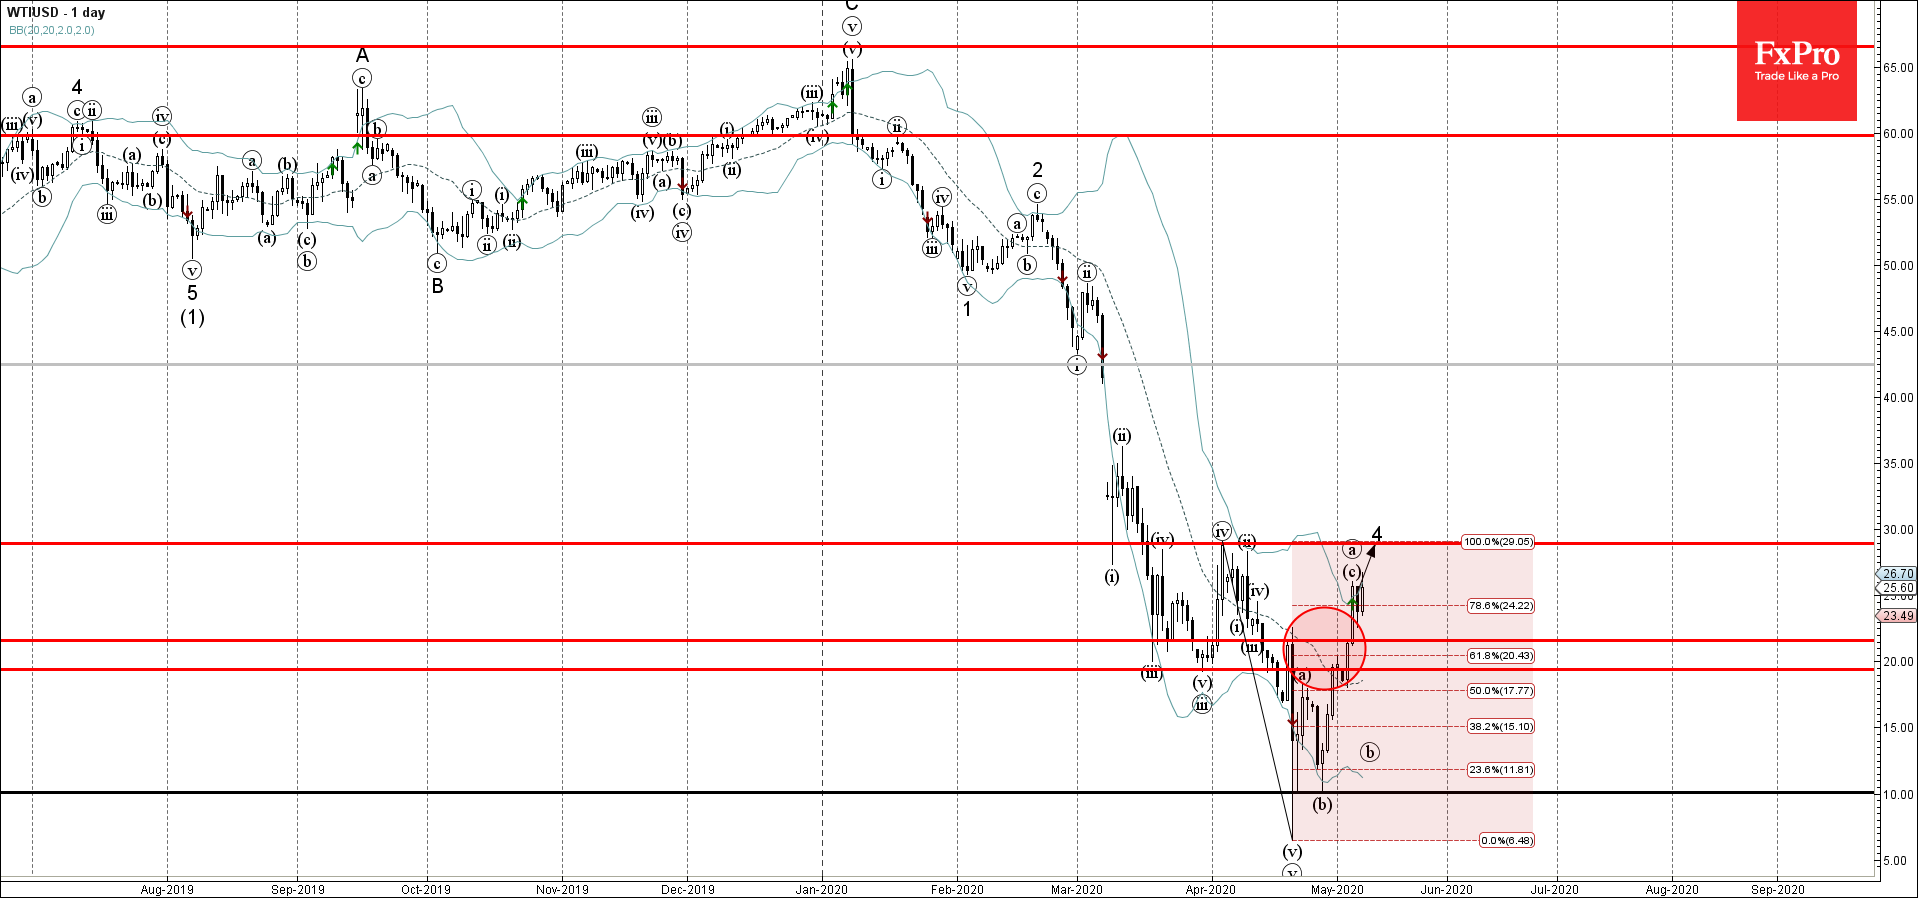
WTI recently broke the resistance area lying between the round resistance level 20,00, resistance level 22.47 and the 61.8% Fibonacci correction of the previous sharp downward impulse (v) from April.

The breakout of this resistance area accelerated the active short-term ABC correction 4.

WTI is expected to rise further toward the next resistance level 28.90 (monthly high from April and the target for the completion of the active correction 4).

The FxPro Tech Analysis Team

The FxPro technical experts prepare a daily analysis of the most active currency pairs (majors, crosses, exotics) and commodities. Selected instruments are reviewed on daily trends (D1, H4), using the active Elliott Wave setups, Japanese candlesticks, indicators, and support/resistance levels.

Share
Published by
The FxPro Tech Analysis Team
Tags: WTIUSD

Recent Posts

CHFJPY Wave Analysis – 15 January 2026

CHFJPY: ⬇️ Sell - CHFJPY reversed from resistance zone - Likely to fall to support level…

4 hours ago

WTI Crude Oil Wave Analysis – 15 January 2026

WTI Crude Oil: ⬇️ Sell - WTI Crude Oil rising inside minor impulse wave (1) -…

4 hours ago

Costco Wave Analysis – 15 January 2026

Costco: ⬆️ Buy - Costco rising inside minor impulse wave (1) - Likely to reach resistance…

4 hours ago

Chevron Wave Analysis – 15 January 2026

Chevron: ⬆️ Buy - Chevron broke strong resistance level 165.00 - Likely to rise to resistance…

4 hours ago

US Indices: growth widens, but are expectations too high?

Tech sell-off and high Q4 forecasts put the S&P 500 at risk; the Russell 2000…

9 hours ago

Markets pick up signals from the White House

Donald Trump has no intention of dismissing Jerome Powell. The White House's decision to postpone…

12 hours ago

This website uses cookies