Categories: Technical analysis

WTI Wave Analysis 29 January 2024

– WTI crude oil reversed from resistance level 79.15

– Likely to fall to support level 75.00

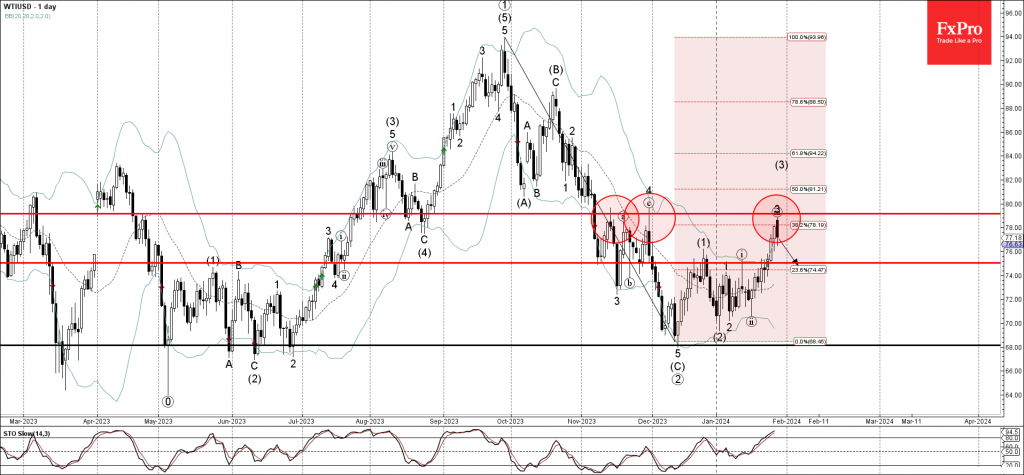
WTI crude oil recently reversed down from the key resistance level 79.15, which has been reversing the price from November, as can be seen below.

The resistance level 79.15 was strengthened by the upper daily Bollinger Band and by the 38.2% Fibonacci correction of the downward impulse from September.

Given the overbought daily Stochastic, WTI crude oil can be expected to fall further to the next support level 75.00 (former top of wave i from the start of this month).

The FxPro Tech Analysis Team

The FxPro technical experts prepare a daily analysis of the most active currency pairs (majors, crosses, exotics) and commodities. Selected instruments are reviewed on daily trends (D1, H4), using the active Elliott Wave setups, Japanese candlesticks, indicators, and support/resistance levels.

Share
Published by
The FxPro Tech Analysis Team
Tags: wti

Recent Posts

EURCAD Wave Analysis 6 September 2024

- EURCAD reversed from pivotal support level 1.4900 - Likely to rise to resistance level…

2 days ago

EURUSD Wave Analysis 6 September 2024

- EURUSD reversed from support level 1.1030 - Likely to rise to resistance level 1.1200…

2 days ago

Further Unwinding of Carry Trade

The unwinding of the carry trade in the FX market continues, with the major safe…

2 days ago

Bitcoin pressured by risk-off mood

Market Picture The pressure on risk assets continues, pushing the crypto market capitalisation back below…

2 days ago

AUDUSD Wave Analysis 5 September 2024

- AUDUSD reversed from support level 0.6700 - Likely to rise to resistance level 0.6800…

2 days ago

Gold Wave Analysis 5 September 2024

- Gold reversed from support level 2475.00 - Likely to rise to resistance level 2535.00…

2 days ago

This website uses cookies