Categories: Technical analysis

WTI Wave Analysis 24 March, 2021

• WTI reversed from support zone

• Likely to reach resistance level 63.10

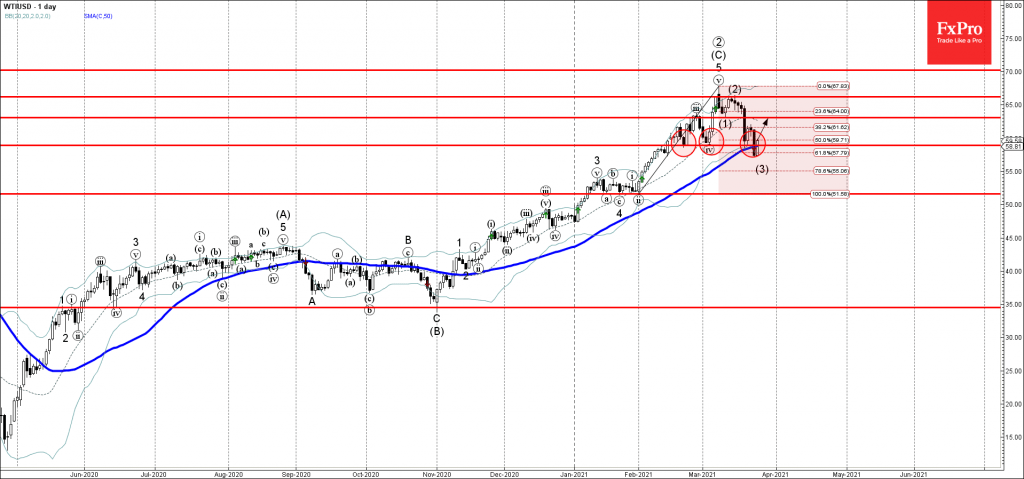
WTI oil previously reversed up from the combined support zone lying at the intersection of the 50-day moving average, 50% Fibonacci correction of the upward impulse from January, the support level 58.80 (which reversed the pair 3 times from February) and the lower daily Bollinger Band.

The upward reversal from this support zone stopped the previous medium-term impulse wave (3).

WTI oil is likely to rise further toward the next resistance level 63.10 (former support from the start of March, which stopped impulse wave (1)).

The FxPro Tech Analysis Team

The FxPro technical experts prepare a daily analysis of the most active currency pairs (majors, crosses, exotics) and commodities. Selected instruments are reviewed on daily trends (D1, H4), using the active Elliott Wave setups, Japanese candlesticks, indicators, and support/resistance levels.

Share
Published by
The FxPro Tech Analysis Team
Tags: wti

Recent Posts

Bitcoin Wave Analysis – 14 January 2026

Bitcoin: ⬆️ Buy - Bitcoin broke resistance area - Likely to rise to resistance level…

4 hours ago

NZDJPY Wave Analysis – 14 January 2026

NZDJPY: ⬇️ Sell - NZDJPY reversed down from the resistance area - Likely to fall…

4 hours ago

What is Leverage?

Leverage is a mechanism that lets traders control larger positions using smaller capital. By choosing…

9 hours ago

The dollar does not tolerate dissent

US GDP growth is driven not by the White House, but by AI. The Bank…

14 hours ago

The crypto market has made a breakthrough

The crypto market surges, hitting new highs, with bullish sentiment for Bitcoin and Ethereum amid…

15 hours ago

Brent Crude oil Wave Analysis – 13 January 2026

Brent Crude oil ⬆️ Buy - Brent Crude oil rising inside impulse wave c -…

1 day ago

This website uses cookies