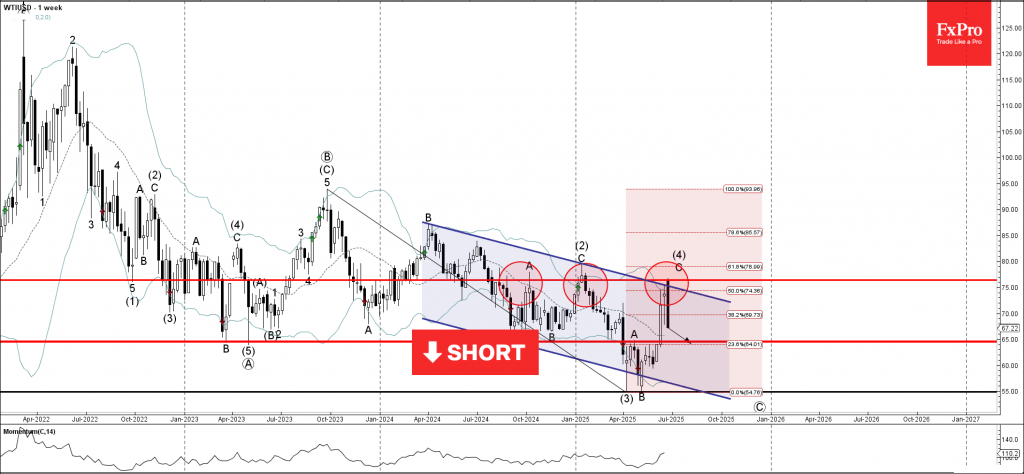
Categories: Technical analysis

WTI Wave Analysis – 23 June 2025

WTI: ⬇️ Sell

– WTI reversed from the resistance area

– Likely to fall to support level 65.00

WTI crude oil recently reversed down from the resistance area located between the pivotal resistance level 76.45 (which has been reversing the price from the middle of last year), the upper weekly Bollinger Band and the resistance trendline of the weekly down channel from 2024.

The downward reversal from this resistance zone stopped the C-wave of the earlier weekly ABC correction (4) from April.

Given the clear weekly downtrend, WTI crude oil can be expected to fall to the next support level 65.00 (a former yearly low from 2024).

The FxPro Tech Analysis Team

The FxPro technical experts prepare a daily analysis of the most active currency pairs (majors, crosses, exotics) and commodities. Selected instruments are reviewed on daily trends (D1, H4), using the active Elliott Wave setups, Japanese candlesticks, indicators, and support/resistance levels.

Share
Published by
The FxPro Tech Analysis Team
Tags: wti

Recent Posts

Do not underestimate dollar

Positive macro statistics for the US are helping the greenback. Gold could rise to $4,610…

48 minutes ago

Crypto fails to find support for a breakout

Crypto markets fell amid caution; Bitcoin and Ethereum face technical and investor shifts, with privacy…

2 hours ago

SP500. Current situation #sp500 #tradelikeapro #trading #trandingshorts #tradingstrategy #fxpro

Today is Thursday, January 8th, and we continue talking about the markets. Today, we will…

3 hours ago

NZDCAD Wave Analysis – 7 January 2026

NZDCAD: ⬆️ Buy - NZDCAD reversed from support zone - Likely to rise to resistance…

16 hours ago

Bitcoin Wave Analysis – 7 January 2026

Bitcoin: ⬇️ Sell - Bitcoin reversed from resistance zone - Likely to fall to support…

16 hours ago

EURGBP Wave Analysis – 7 January 2026

EURGBP: ⬆️ Buy - EURGBP reversed from support zone - Likely to rise to resistance…

16 hours ago

This website uses cookies