Categories: Technical analysis

WTI Wave Analysis – 20 November , 2018

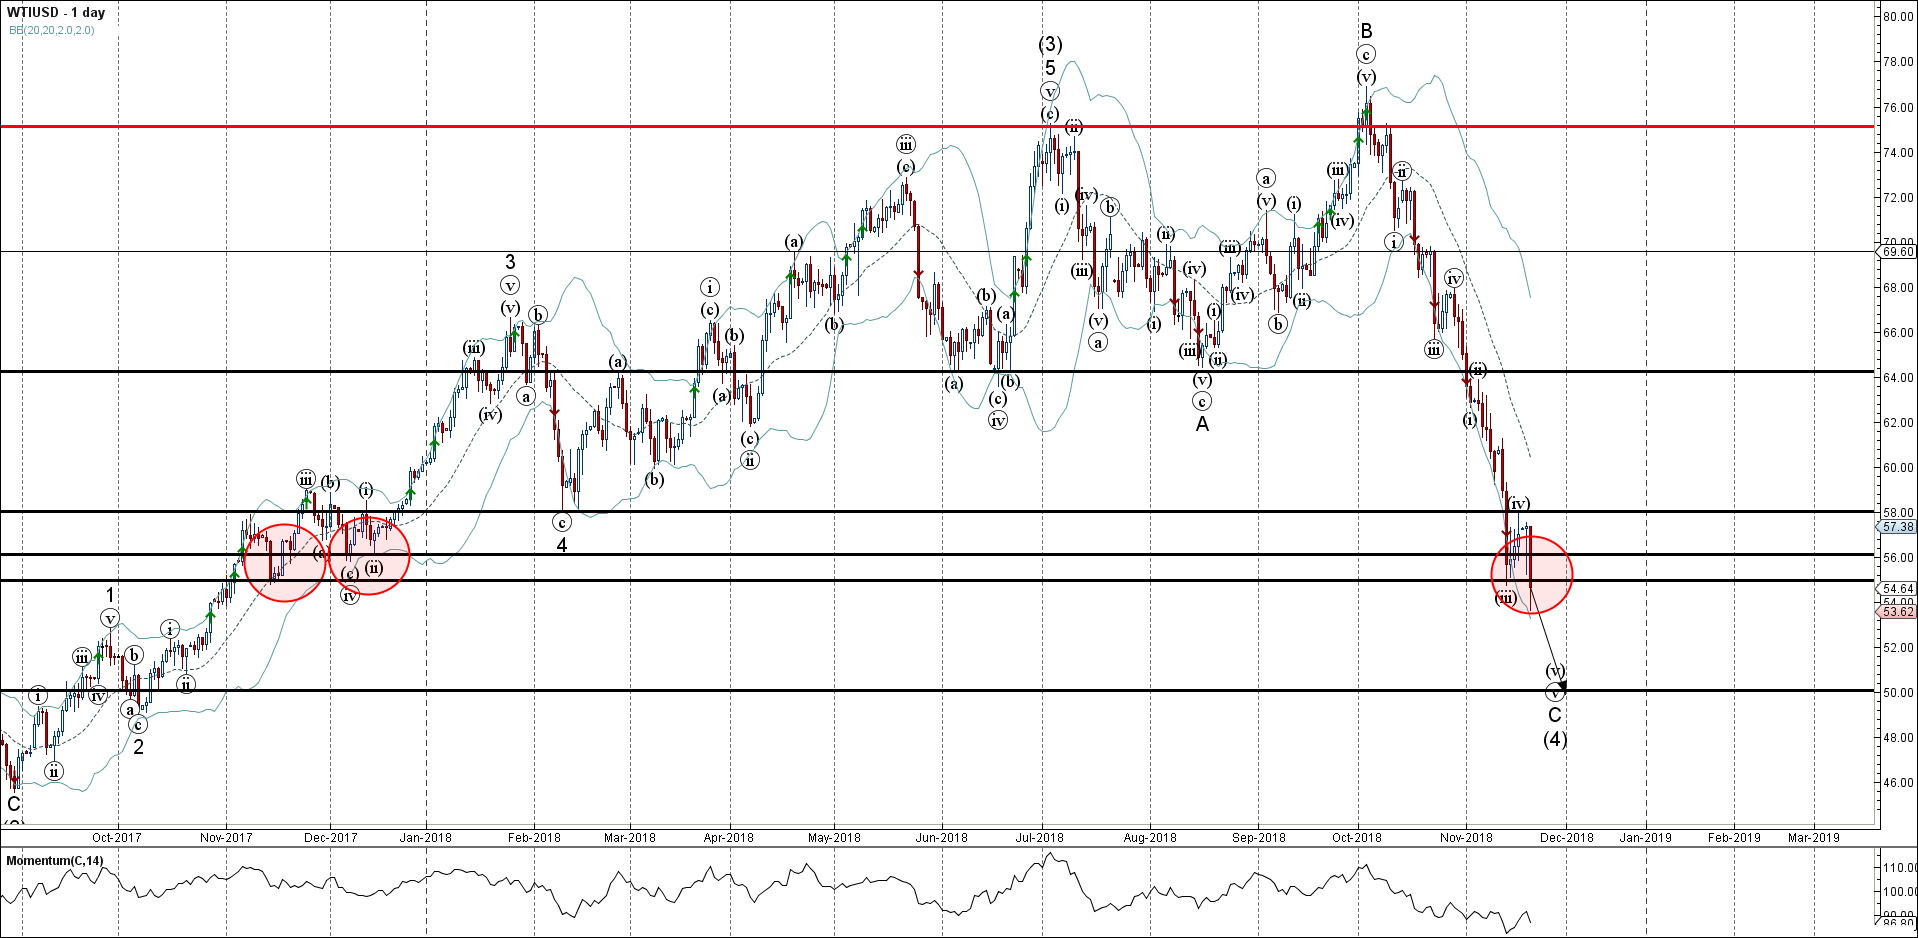
  • WTI broke support area
  • Further losses are likely

WTI today broke through the support area lying between the key support levels 55.00 (monthly low from November of 2017) and 56.00 (which stopped the price earlier this month).

The breakout of this support area continues the active short-term impulse wave C – which belongs to the intermediate ABC correction (4) from the start of July.

WTI is expected to fall further and re-test the next round support level 50.00 (target price for the completion of the active impulse wave C).

AddThis Website Tools
The FxPro Tech Analysis Team

The FxPro technical experts prepare a daily analysis of the most active currency pairs (majors, crosses, exotics) and commodities. Selected instruments are reviewed on daily trends (D1, H4), using the active Elliott Wave setups, Japanese candlesticks, indicators, and support/resistance levels.

Share
Published by
The FxPro Tech Analysis Team
Tags: WTIUSD

Recent Posts

Apple Wave Analysis – 20 March 2025

Apple: ⬇️ Sell - Apple reversed from resistance level 220.00 - Likely to fall to…

2 hours ago

IBM Wave Analysis – 20 March 2025

IBM: ⬆️ Buy - IBM reversed from support zone - Likely to rise to resistance…

2 hours ago

AUDNZD Wave Analysis – 20 March 2025

AUDNZD: ⬆️ Buy - AUDNZD reversed from key support level 1.0930 - Likely to rise…

4 hours ago

EURCAD Wave Analysis – 20 March 2025

EURCAD: ⬇️ Sell - EURCAD reversed from the resistance zone - Likely to fall to…

4 hours ago

Crypto Market Testing Resistance

The crypto market has increased by over 5% and is nearing the $2.9 trillion. The…

9 hours ago

Gold Wave Analysis – 19 March 2025

Gold: ⬆️ Buy - Gold continues daily uptrend - Likely to rise to resistance level…

23 hours ago