Categories: Technical analysis

WTI Wave Analysis 2 October 2024

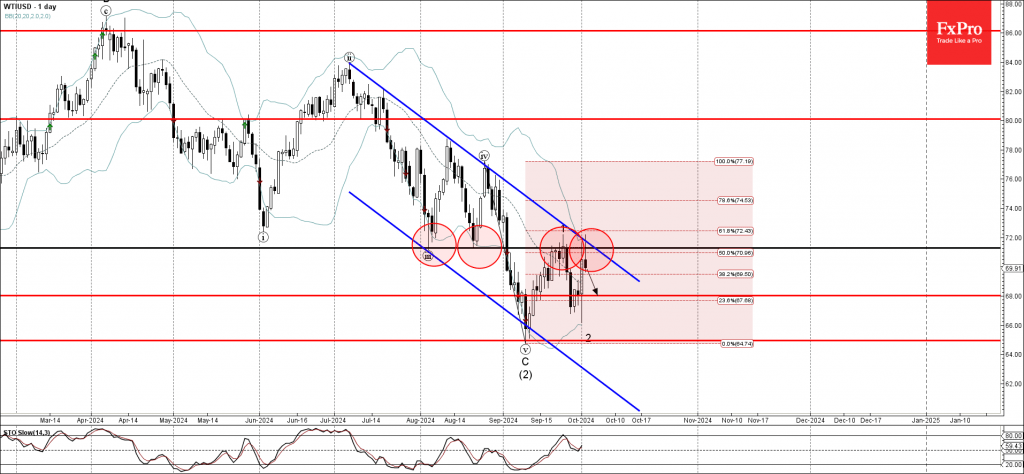
– WTI reversed from pivotal resistance level 71.30

– Likely to fall to support level 68.00

WTI crude oil recently reversed down from the pivotal resistance level 71.30 (former double bottom from August) intersecting with the upper daily Bollinger Band and the resistance trendline of the daily down channel from July.

The downward reversal from the resistance level 71.30 is likely to form the daily Japanese candlesticks reversal pattern Shooting Star.

Given the clear daily downtrend, WTI crude oil can be expected to fall further to the next support level 68.00.

The FxPro Tech Analysis Team

The FxPro technical experts prepare a daily analysis of the most active currency pairs (majors, crosses, exotics) and commodities. Selected instruments are reviewed on daily trends (D1, H4), using the active Elliott Wave setups, Japanese candlesticks, indicators, and support/resistance levels.

Share
Published by
The FxPro Tech Analysis Team
Tags: wti

Recent Posts

EURAUD Wave Analysis 3 October 2024

EURAUD reversed from strong support level 1.6020 Likely to rise to resistance level 1.6260 EURAUD…

6 hours ago

EURCAD Wave Analysis 3 October 2024

- EURCAD reversed from key support level 1.4900 - Likely to rise to resistance level…

6 hours ago

Dollar Growth or Just a Rebound? NFP Holds the Key

The Dollar Index is rising for the fourth consecutive day, gaining over 1.7%, and is…

7 hours ago

The crypto market is still falling, but Bitcoin has already stabilised

The crypto market lost 1.44% of its capitalisation in 24 hours to $2.13 trillion amid…

13 hours ago

Apple Wave Analysis 2 October 2024

- Apple reversed from support level 225.00 - Likely to rise to resistance level 232.50…

1 day ago

The Hang Seng Is Too Hot Now, but Long-Term Attractive

The Hang Seng is up 9.6% from its closing level on 30th September, the second…

1 day ago

This website uses cookies