Categories: Technical analysis

WTI Wave Analysis 2 October, 2020

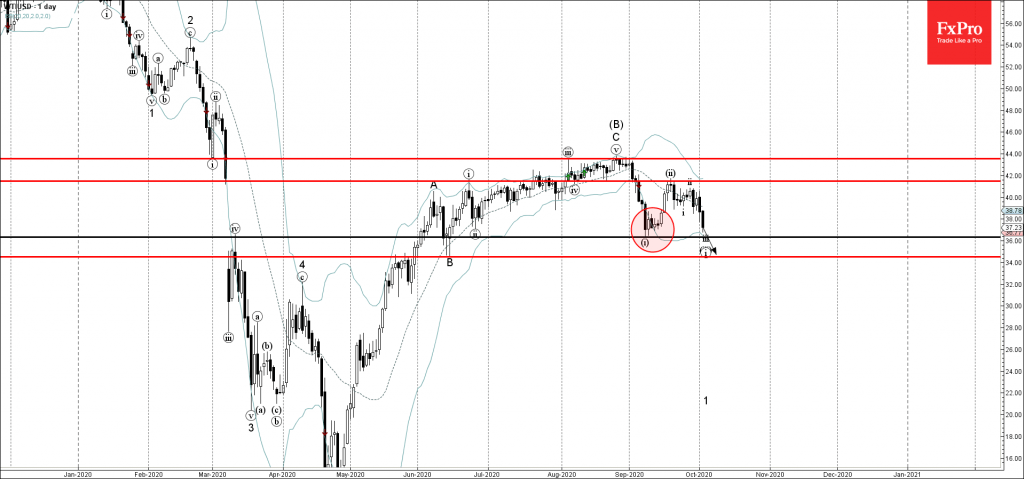
• WTI approached strong support level 36.30

• Likely to fall to 34.50

WTI continues to fall inside the minor downward impulse wave (i), which belongs to the longer-term downward impulse sequence (C) from the end of August.

The price is currently trading near the strong support level 36.30 (which stopped the previous minor impulse wave (i) at the start of September).

If WTI breaks below the support level 36.30 – the price can then fall to the next support level 34.50 (low of wave B from June).

The FxPro Tech Analysis Team

The FxPro technical experts prepare a daily analysis of the most active currency pairs (majors, crosses, exotics) and commodities. Selected instruments are reviewed on daily trends (D1, H4), using the active Elliott Wave setups, Japanese candlesticks, indicators, and support/resistance levels.

Share
Published by
The FxPro Tech Analysis Team
Tags: wti

Recent Posts

Crude Oil counteracts

Middle East tensions and Venezuelan supply shifts drive Brent crude volatility, with geopolitical risks and…

3 hours ago

Crypto market grows with risk appetite in stocks

Crypto market edges up as risk appetite returns; Bitcoin and Ethereum recover, despite investor caution…

4 hours ago

The yen returned to the Takaichi trade

The dollar resumed its growth after the lawsuit against the Fed chairman. Rumours of early…

5 hours ago

Nat Gas Current situation #tradelikeapro #trading #natgas #tradingstrategy #tradingshorts

Today is Tuesday, the 13th of January, and we will talk about the natural gas…

7 hours ago

Bitcoin Cash Wave Analysis – 12 January 2026

Bitcoin Cash: ⬇️ Sell - Bitcoin Cash reversed from resistance area - Likely to fall…

16 hours ago

EURJPY Wave Analysis – 12 January 2026

EURJPY: ⬆️ Buy - EURJPY reversed from support area - Likely to rise to resistance…

16 hours ago

This website uses cookies