Categories: Technical analysis

WTI Wave Analysis 2 February, 2021

• WTI broke sideways price range

• Likely to test resistance level 56.00

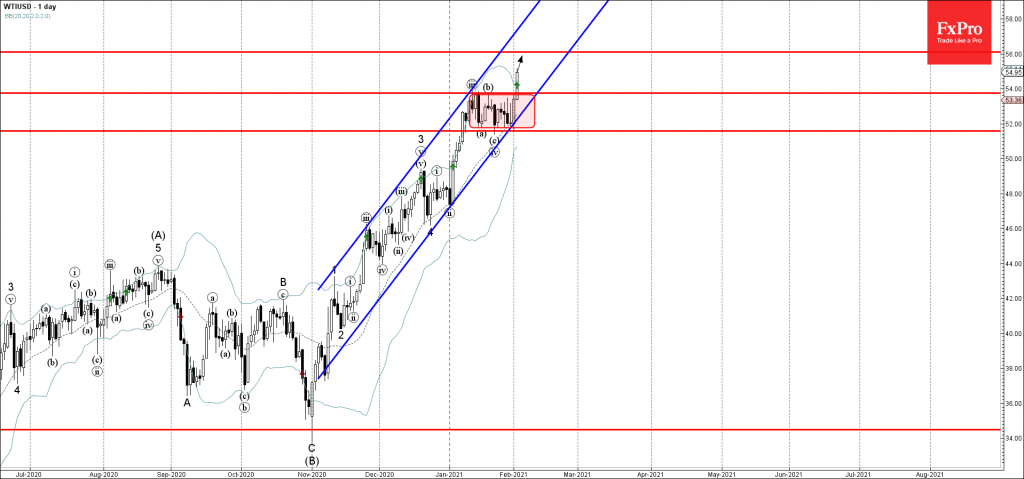
WTI oil recently broke the minor resistance level 53.75 (which is the upper boundary of the tight sideways price range from the start of January).

The breakout of this price range accelerated the active short-term impulse wave (v) – which belongs to the sharp impulse wave 5 of the longer-term upward impulse sequence (C) from November.

Given the clear uptrend – WTI can be expected to rise further toward the next resistance level 56.00. Strong support now stands at the aforementioned price level 53.75.

The FxPro Tech Analysis Team

The FxPro technical experts prepare a daily analysis of the most active currency pairs (majors, crosses, exotics) and commodities. Selected instruments are reviewed on daily trends (D1, H4), using the active Elliott Wave setups, Japanese candlesticks, indicators, and support/resistance levels.

Share
Published by
The FxPro Tech Analysis Team
Tags: WTIUSD

Recent Posts

AUDJPY Wave Analysis – 5 December 2025

AUDJPY: ⬆️ Buy - AUDJPY broke long-term resistance level 102.30 - Likely to rise to…

18 hours ago

Aptos Wave Analysis – 5 December 2025

Aptos: ⬇️ Sell - Aptos testing major support at 1.688 - Likely to fall to…

18 hours ago

Pro News Weekly: Market Shake-Up, Dollar Drops, Gold Surges, Bitcoin Wobbles!

Welcome to Pro News Flash! 💵 The U.S. dollar slips 🏆 Major stock indices struggle…

1 day ago

Solana Wave Analysis – 5 December 2025

Solana: ⬇️ Sell - Solana reversed from resistance zone - Likely to fall to support…

1 day ago

EURAUD Wave Analysis – 5 December 2025

EURAUD : ⬇️ Sell - EURAUD broke the support level 1.7600 - Likely to fall…

1 day ago

Forex has set its priorities

In 2026, experts favour the yen, see modest euro growth, and expect pressure on the…

1 day ago

This website uses cookies