Categories: Technical analysis

WTI Wave Analysis – 18 May, 2020

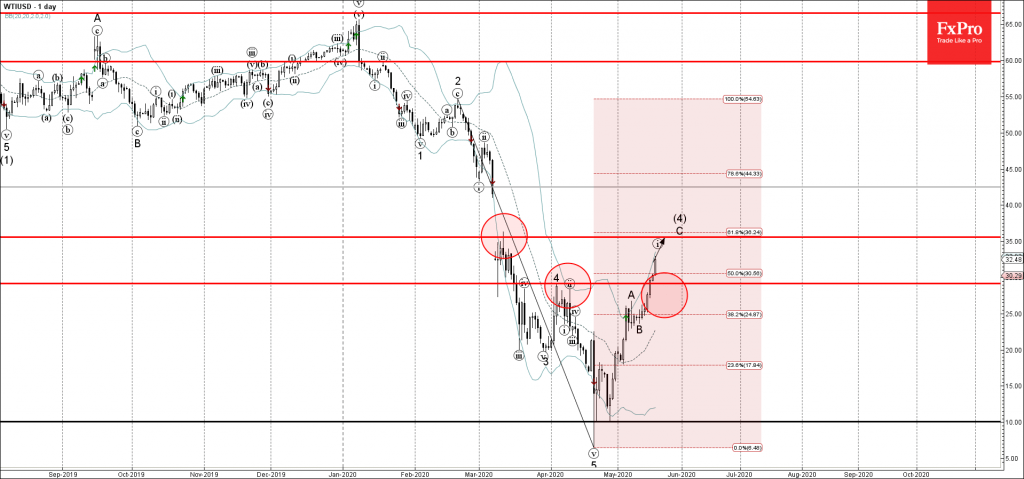
• WTI under bullish pressure

• Likely to rise to 35.00

WTI has been under bullish pressure after the price broke the resistance zone located between the resistance level 29.17 (top of the previous waves 4 and (ii)) and the 50% Fibonacci correction of the previous downward impulse from February.

The breakout of this resistance zone accelerated the C-wave of the active medium-term corrective wave (4). WTI is likely to rise further toward the next resistance level 35.00 (former resistance from March and the target for the completion of wave (4)).

AddThis Website Tools
The FxPro Tech Analysis Team

The FxPro technical experts prepare a daily analysis of the most active currency pairs (majors, crosses, exotics) and commodities. Selected instruments are reviewed on daily trends (D1, H4), using the active Elliott Wave setups, Japanese candlesticks, indicators, and support/resistance levels.

Share
Published by
The FxPro Tech Analysis Team
Tags: WTIUSD

Recent Posts

AMD Wave Analysis – 28 March 2025

AMD: ⬇️ Sell - AMD reversed from pivotal resistance level 115.00 - Likely to fall…

3 hours ago

Google Wave Analysis – 28 March 2025

Google: ⬇️ Sell - Google broke key support level 160.00 - Likely to fall to…

3 hours ago

Gold Wave Analysis – 28 March 2025

Gold: ⬆️ Buy - Gold broke resistance level 3050.00 - Likely to rise to resistance…

3 hours ago

Ethereum Wave Analysis – 28 March 2025

Ethereum: ⬇️ Sell - Ethereum reversed from the resistance level 2120.00 - Likely to fall…

3 hours ago

US inflation accelerates but lags income growth

US PCE inflation exceeded expectations at 2.8% in February. Income growth and savings rates remain…

8 hours ago

What is next: Australia Rate, EU CPI, US NFP

Europe will switch to daylight saving time next week. Key events include the RBA's rate…

10 hours ago