Categories: Technical analysis

WTI Wave Analysis – 18 December , 2018

  • WTI broke through the support level 50.00
  • Further losses are likely

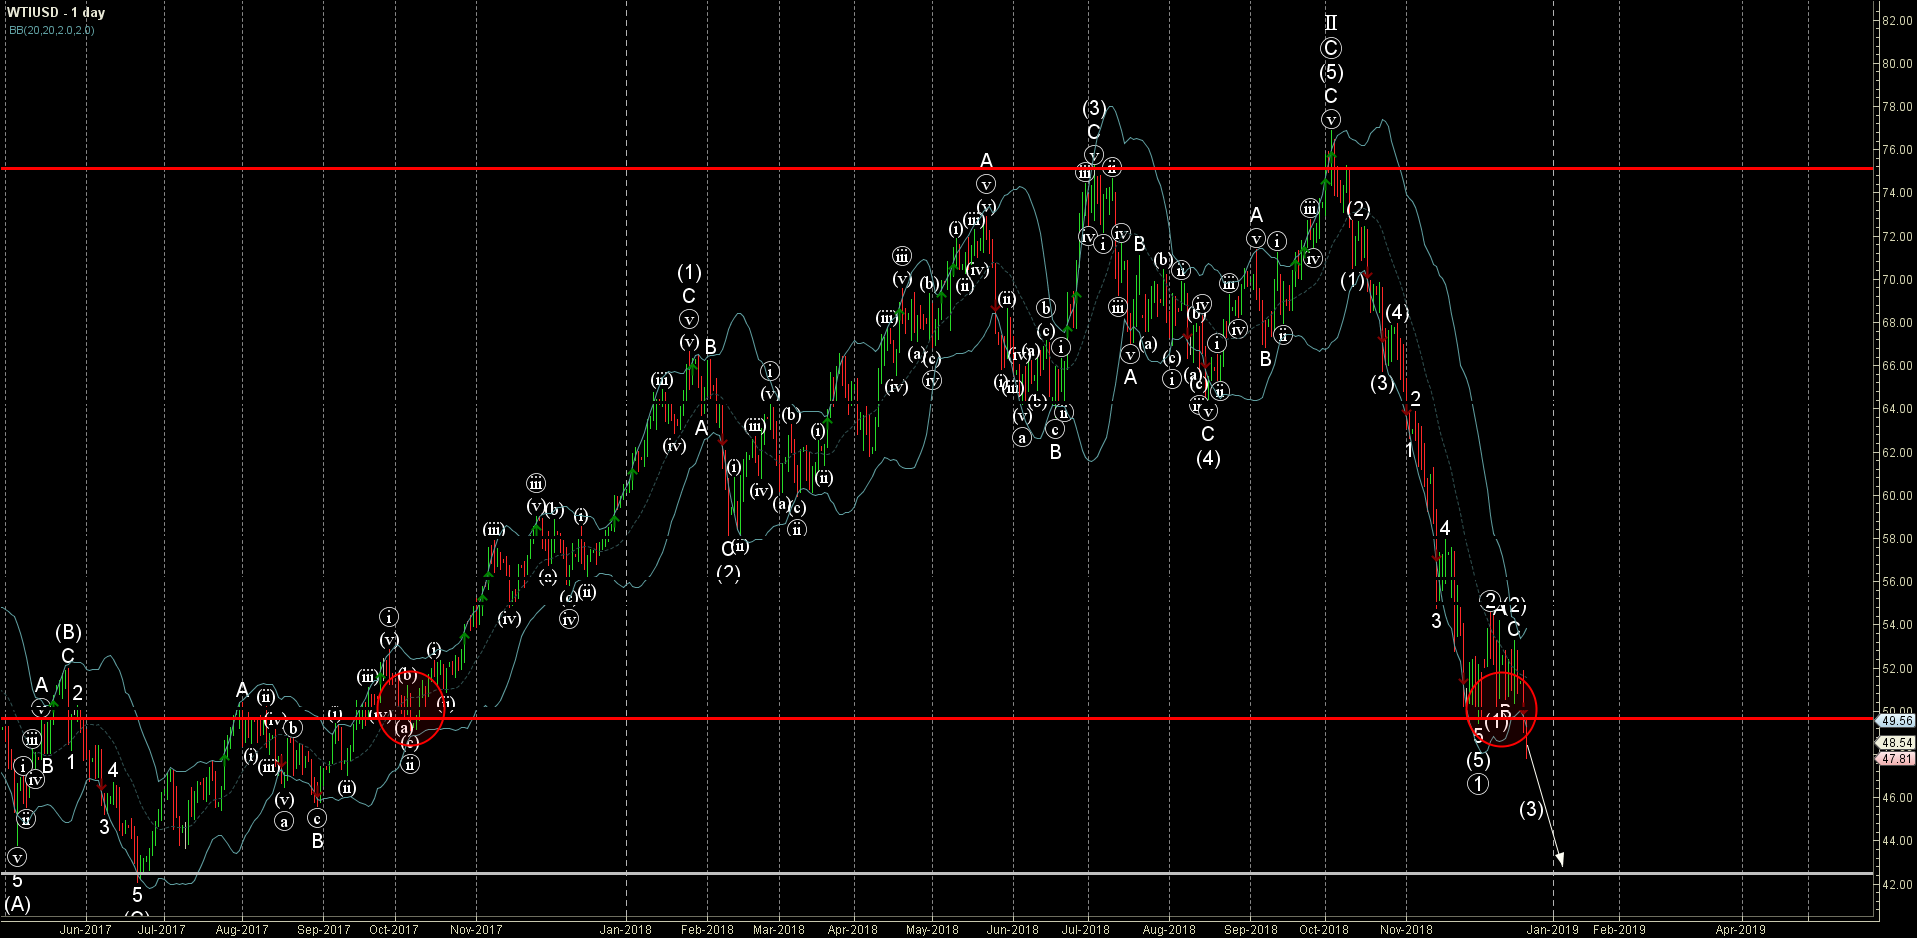
WTI today broke through the powerful round support level 50.00 (which has been steadily reversing the price from October of 2017 – as can be seen below).

The breakout of the support level 50.00 accelerated the active medium-term impulse wave (3) – which belongs to the sharp downward impulse sequence from the star of October.

WTI is expected to fall further and re-test the next multi-month support level 42.50 (which reversed the price in the June of 2017). Strong resistance now stands at 50.00.

The FxPro Tech Analysis Team

The FxPro technical experts prepare a daily analysis of the most active currency pairs (majors, crosses, exotics) and commodities. Selected instruments are reviewed on daily trends (D1, H4), using the active Elliott Wave setups, Japanese candlesticks, indicators, and support/resistance levels.

Share
Published by
The FxPro Tech Analysis Team
Tags: WTIUSD

Recent Posts

Adobe Wave Analysis 3 May 2024

- Adobe reversed from support zone - Likely to rise to resistance level 500.00 Adobe…

2 days ago

EURGBP Wave Analysis 3 May 2024

- EURJPY reversed from support zone - Likely to rise to resistance level 0.8625 EURGBP…

2 days ago

How Low Can the USDJPY Go?

USDJPY was slipping below 153 on Friday morning, a three-week low and having lost over…

3 days ago

Bitcoin’s Downtrend, Solana and Ethereum Form Double Bottom

Market picture  Crypto market capitalisation rose 3.3% in 24 hours to $2.22 trillion. Local capitalisation…

3 days ago

EURJPY Wave Analysis 2 May 2024

- EURJPY under strong bearish pressure - Likely to fall to support level 163.10 EURJPY…

3 days ago

WTI crude oil Wave Analysis 2 May 2024

- WTI broke round support level 80.00 - Likely to fall to support level 76.00…

3 days ago

This website uses cookies